> ## Documentation Index
> Fetch the complete documentation index at: https://promptwatch.com/docs/llms.txt
> Use this file to discover all available pages before exploring further.
# AI crawler insights
> Crawler Logs show which AI bots visit your site, how often, which pages they fetch, and what response they got, streamed from your CDN in near real-time.
Crawler Logs answer three questions about AI bots on your site: who is crawling, how often, and which pages. Every request from an AI crawler, GPTBot fetching your pricing page, PerplexityBot reading your docs, ClaudeBot hitting a 404, is captured and shown with its status code, so you see both the attention you're getting and the requests that failed.
You'll find it in the sidebar under **Crawler Logs**, with an **Overview** tab, a **Top Pages** tab, and a settings page.
### How the data gets here
A lightweight integration at your CDN or edge layer captures AI crawler requests and streams them to your dashboard, no code changes to your website needed:
1. An AI bot sends an HTTP request to your domain.
2. Your CDN or edge (Cloudflare, Akamai, Fastly, CloudFront, and others, or a manual setup) identifies the crawler by its user agent and forwards the log to Promptwatch.
3. The crawler gets your page as normal; the log lands in your dashboard in near real-time.
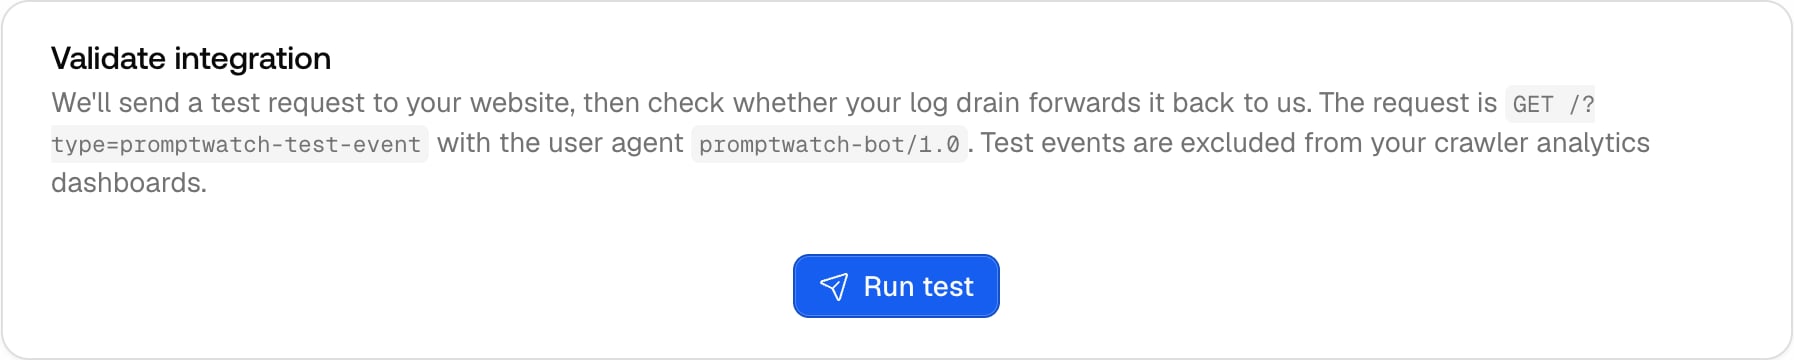
Setup is a guided flow the first time you open the page, and [Log ingestion](/docs/academy/log-ingestion) covers the integration options. On the settings page, **Validate integration** can fire a test event: a request to your site with the Promptwatch bot user agent, which Promptwatch then watches for in your logs, so you know the pipeline works end to end before real crawler data matters.
 One thing to know when reading the numbers: anyone can fake a user agent. For providers that publish IP ranges (OpenAI, Anthropic, Perplexity, Mistral, and Google's user-triggered agents), Promptwatch checks the request IP against those ranges and drops failed checks; Claude Citations is the exception, where you can opt unconfirmed visits back in. Crawlers with no published IP list are counted on user agent alone. Counts can be a bit lower than naive log-grepping as a result, and more trustworthy.
### The Overview tab
* **Comparison stats**: four citation-crawler cards (ChatGPT Citations, Perplexity Citations, Claude Citations, Mistral AI Citations) for the selected range, each compared against the previous period, so a citation bot going quiet or ramping up is the first thing you see.
* **Crawl trend**: requests over time, one series per crawler. Pick the 24-hour preset and the chart switches to minute-level granularity, useful right after a launch or a robots.txt change.
One thing to know when reading the numbers: anyone can fake a user agent. For providers that publish IP ranges (OpenAI, Anthropic, Perplexity, Mistral, and Google's user-triggered agents), Promptwatch checks the request IP against those ranges and drops failed checks; Claude Citations is the exception, where you can opt unconfirmed visits back in. Crawlers with no published IP list are counted on user agent alone. Counts can be a bit lower than naive log-grepping as a result, and more trustworthy.
### The Overview tab
* **Comparison stats**: four citation-crawler cards (ChatGPT Citations, Perplexity Citations, Claude Citations, Mistral AI Citations) for the selected range, each compared against the previous period, so a citation bot going quiet or ramping up is the first thing you see.
* **Crawl trend**: requests over time, one series per crawler. Pick the 24-hour preset and the chart switches to minute-level granularity, useful right after a launch or a robots.txt change.
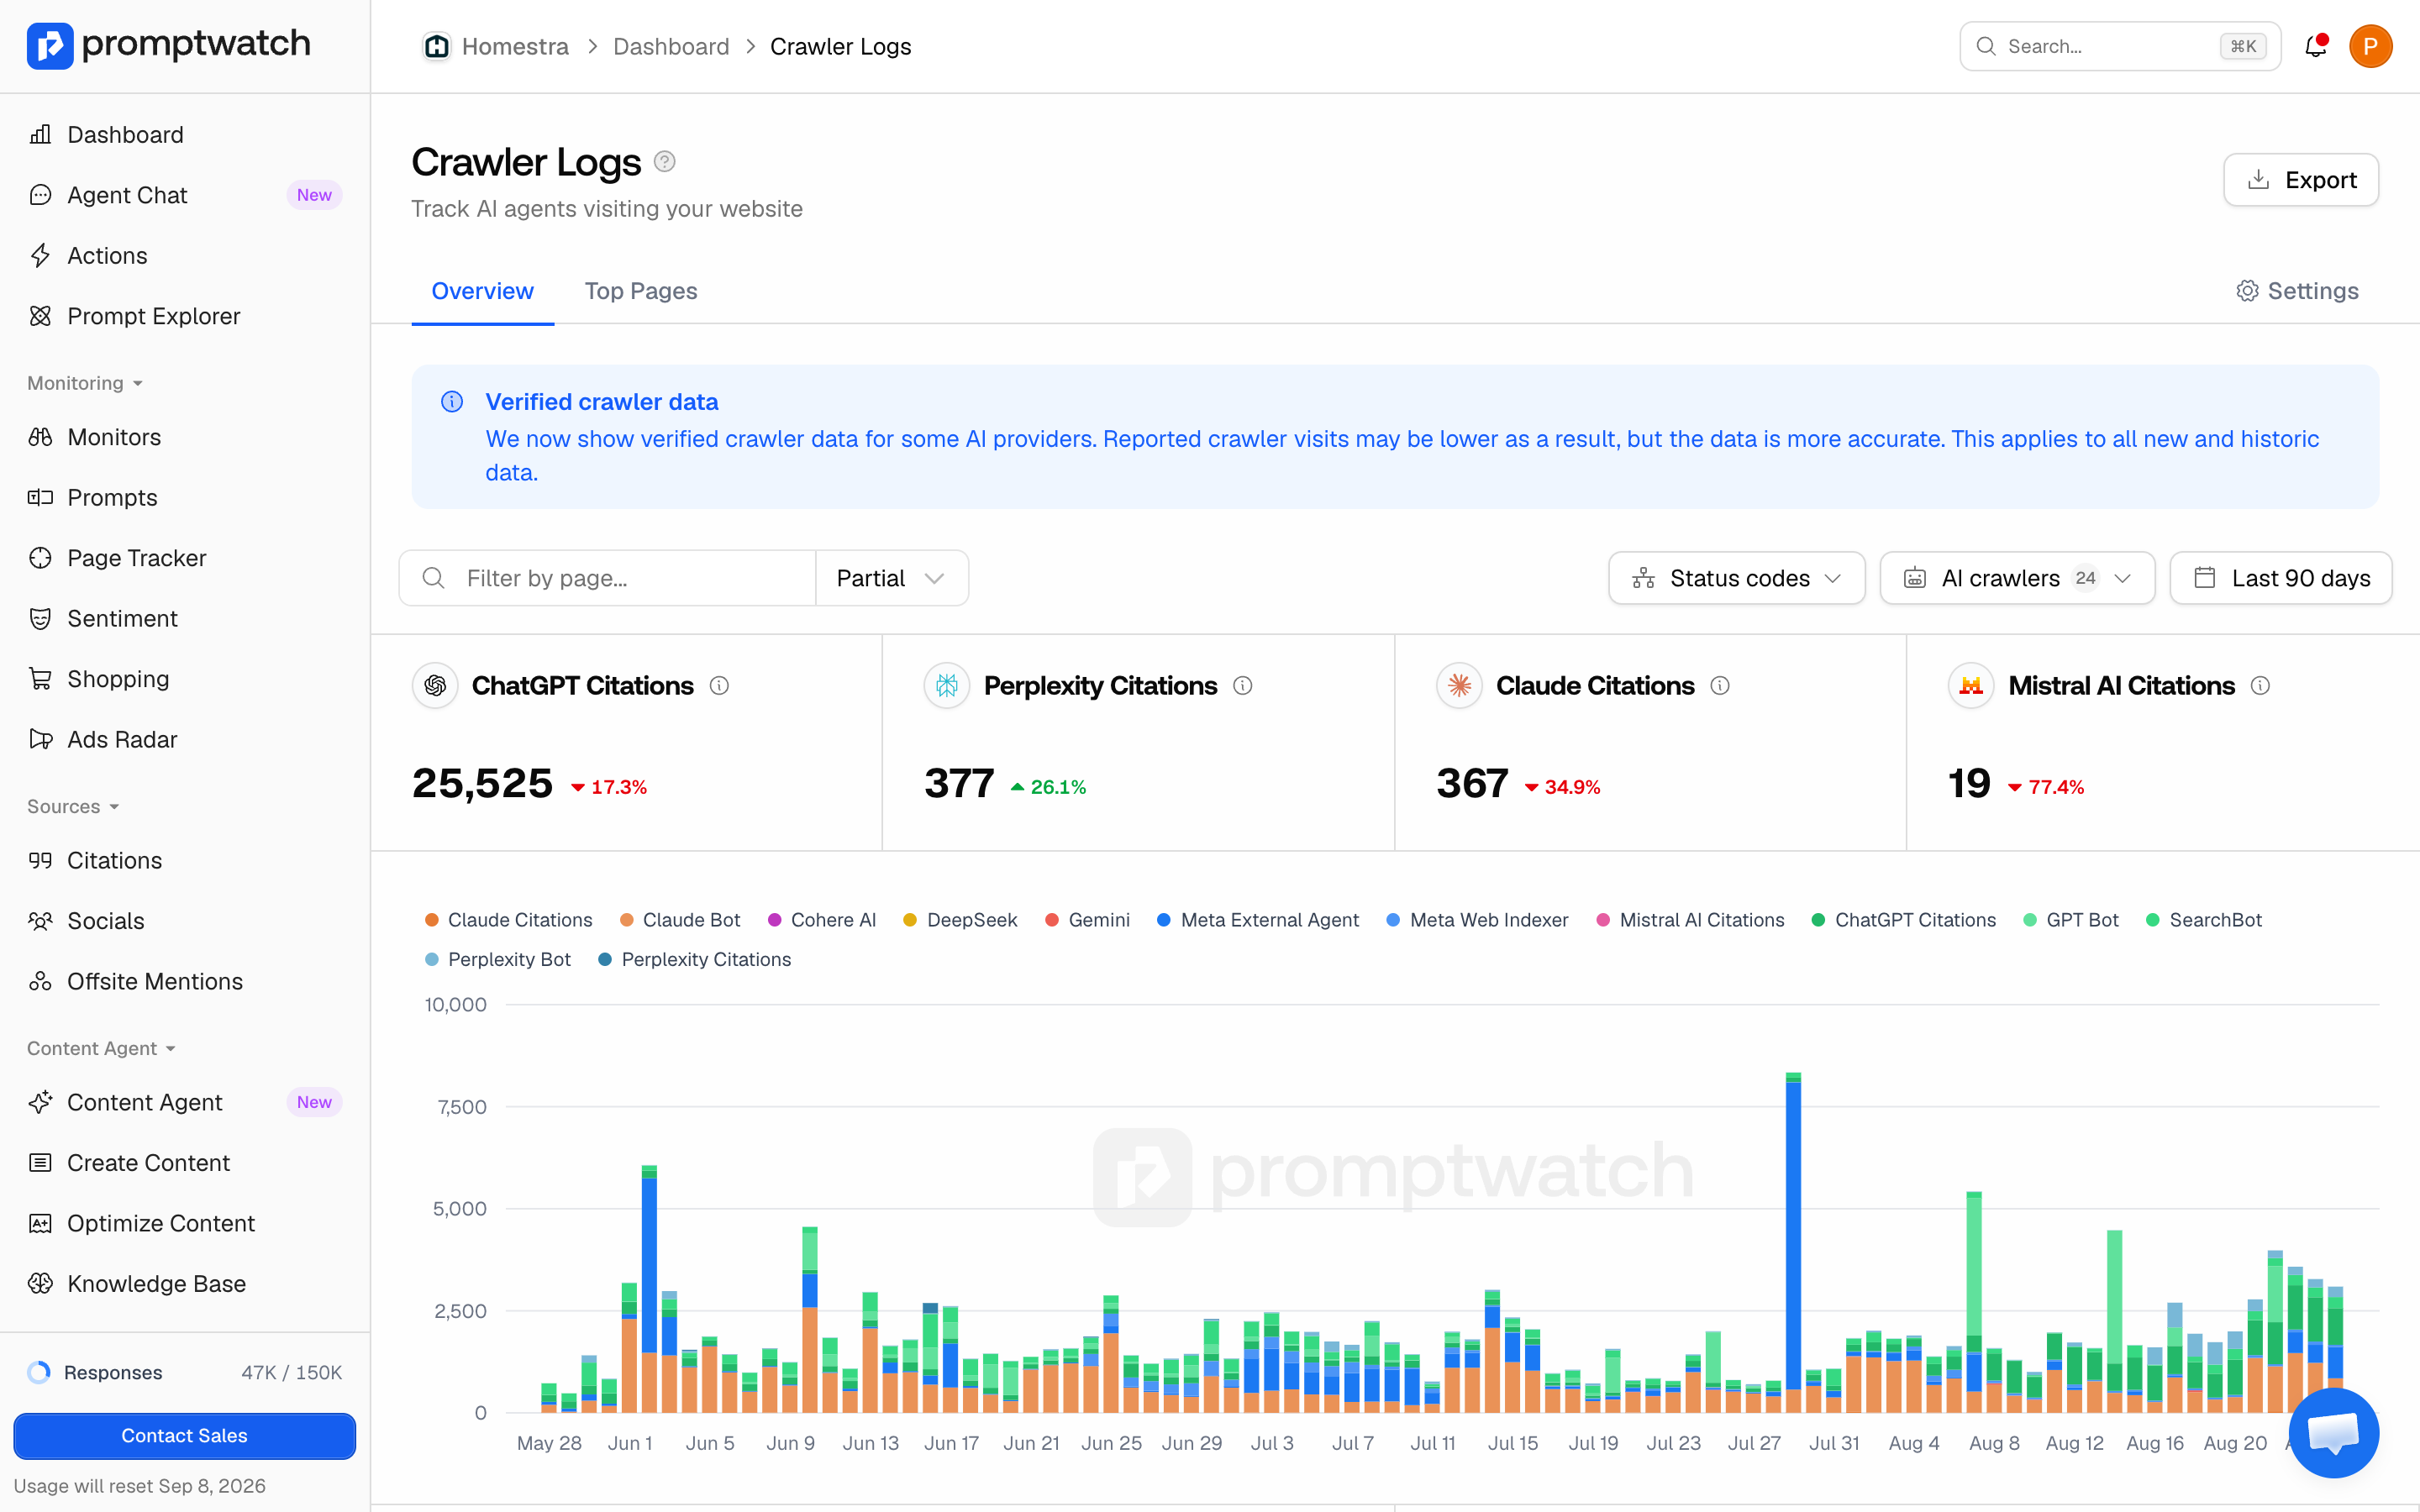 * **Top Pages and Top Crawlers**: side by side, the most fetched paths and the most active bots. If the pages AI models care about aren't the pages you care about, that gap is your content signal.
* **Raw log table**: every event with its time, crawler, status code, method, path, query string, and referrer. This is where you diagnose a specific problem: which exact URLs return 403 to which exact bot.
The trend, Top Pages, Top Crawlers, and the raw log table filter by date range, crawler, status code, and path (exact or partial match). The comparison cards follow the date, status, and path filters but always show those four citation crawlers. Path links jump into the page inspector for anything that's a real page.
### The Top Pages tab
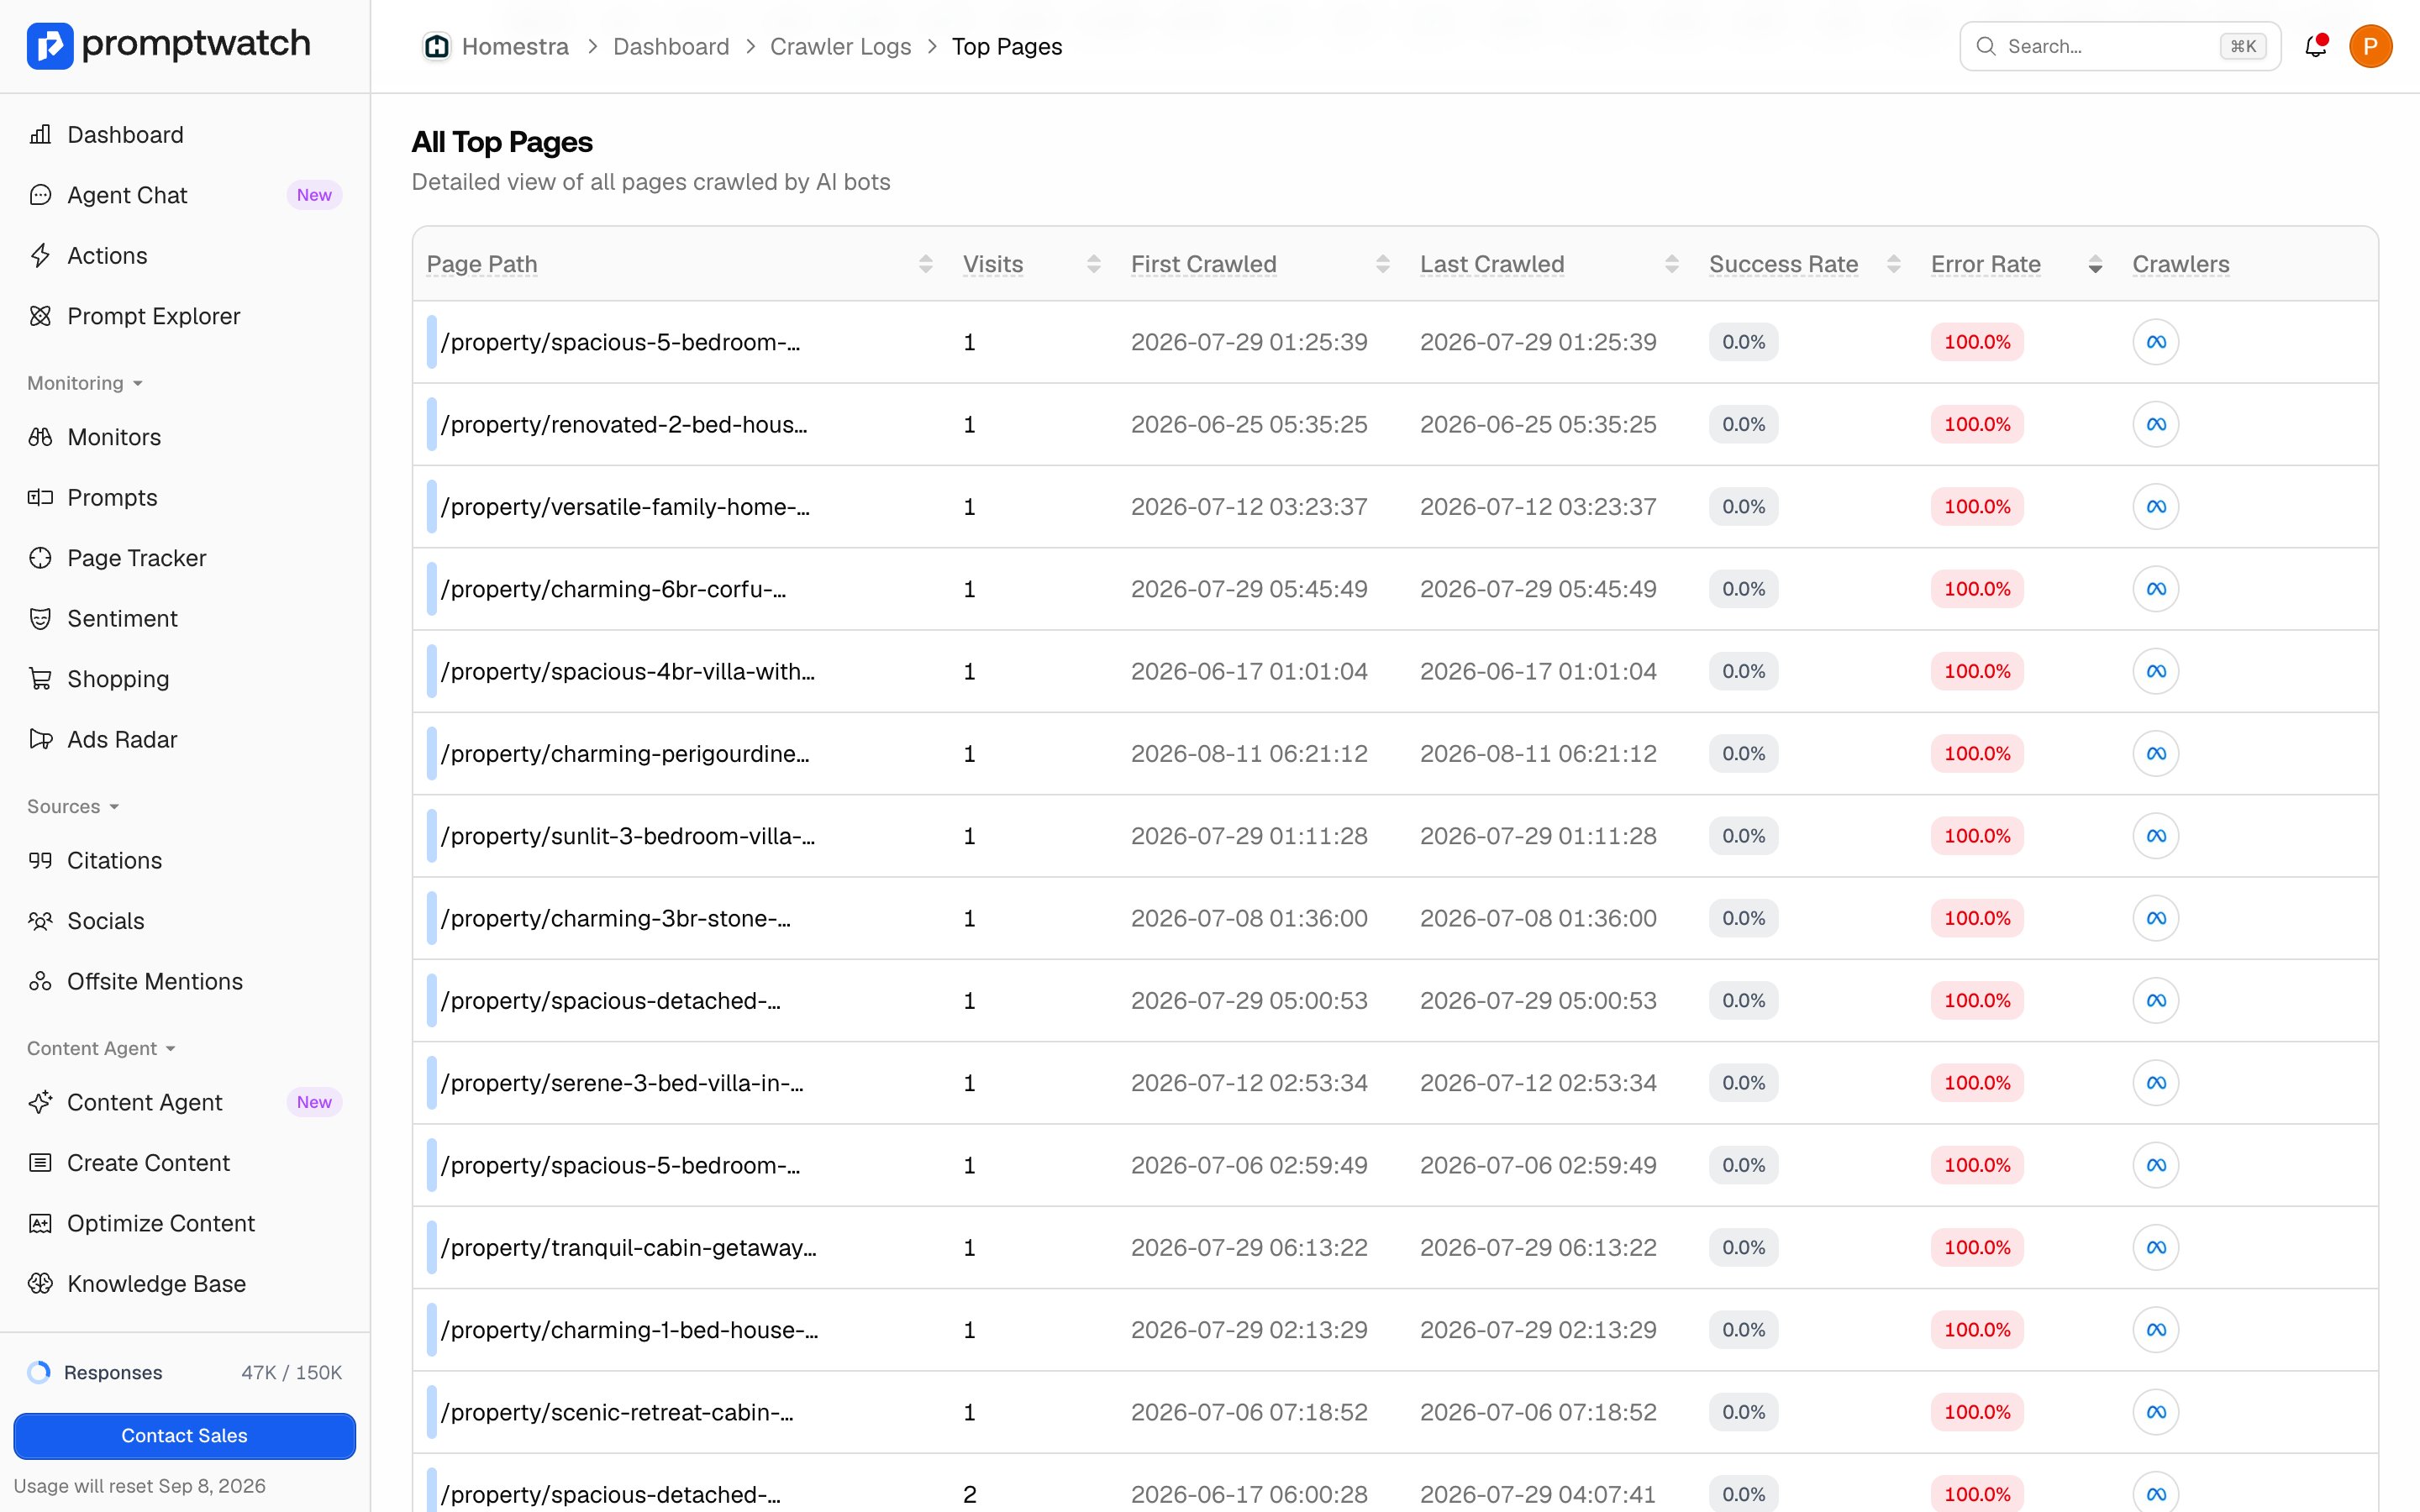
A per-path table built for auditing: requests, first crawled, last crawled, success rate, and error rate for every path in the range, sortable by any of those columns and exportable to CSV. Sorting by error rate is a quick way to find crawl problems; sorting by first crawled shows whether new content is being discovered (first crawled means first request in the selected range).
* **Top Pages and Top Crawlers**: side by side, the most fetched paths and the most active bots. If the pages AI models care about aren't the pages you care about, that gap is your content signal.
* **Raw log table**: every event with its time, crawler, status code, method, path, query string, and referrer. This is where you diagnose a specific problem: which exact URLs return 403 to which exact bot.
The trend, Top Pages, Top Crawlers, and the raw log table filter by date range, crawler, status code, and path (exact or partial match). The comparison cards follow the date, status, and path filters but always show those four citation crawlers. Path links jump into the page inspector for anything that's a real page.
### The Top Pages tab
A per-path table built for auditing: requests, first crawled, last crawled, success rate, and error rate for every path in the range, sortable by any of those columns and exportable to CSV. Sorting by error rate is a quick way to find crawl problems; sorting by first crawled shows whether new content is being discovered (first crawled means first request in the selected range).
 ### How to read what you see
* **Mostly 200s and steady activity**: healthy. Crawl spikes typically follow content publishes and sitemap updates.
* **403s concentrated on one crawler**: a bot-protection or firewall rule is blocking that provider. See [Crawlability](/docs/academy/crawlability) for where blocks come from and what each bot type does.
* **404 clusters**: moved or deleted pages still being requested. Redirect them, the crawler is telling you it still wants that content.
* **A provider missing entirely**: that model's bots either can't reach you or haven't found you.
Crawls are the earliest signal in the funnel: a bot fetching a page today is a precondition for that page being cited tomorrow. To connect crawls to citations and clicks per page, use the [Page Tracker](/docs/academy/page-tracker); for turning crawl patterns into content decisions, see [Turn crawler logs into opportunities](/docs/academy/crawler-logs-into-opportunities).
### How to read what you see
* **Mostly 200s and steady activity**: healthy. Crawl spikes typically follow content publishes and sitemap updates.
* **403s concentrated on one crawler**: a bot-protection or firewall rule is blocking that provider. See [Crawlability](/docs/academy/crawlability) for where blocks come from and what each bot type does.
* **404 clusters**: moved or deleted pages still being requested. Redirect them, the crawler is telling you it still wants that content.
* **A provider missing entirely**: that model's bots either can't reach you or haven't found you.
Crawls are the earliest signal in the funnel: a bot fetching a page today is a precondition for that page being cited tomorrow. To connect crawls to citations and clicks per page, use the [Page Tracker](/docs/academy/page-tracker); for turning crawl patterns into content decisions, see [Turn crawler logs into opportunities](/docs/academy/crawler-logs-into-opportunities).