> ## Documentation Index
> Fetch the complete documentation index at: https://promptwatch.com/docs/llms.txt
> Use this file to discover all available pages before exploring further.
# Server and CDN log ingestion
> Stream your server or CDN access logs to Promptwatch to see which AI crawlers visit your site, which pages they fetch, and how that maps to your citations.
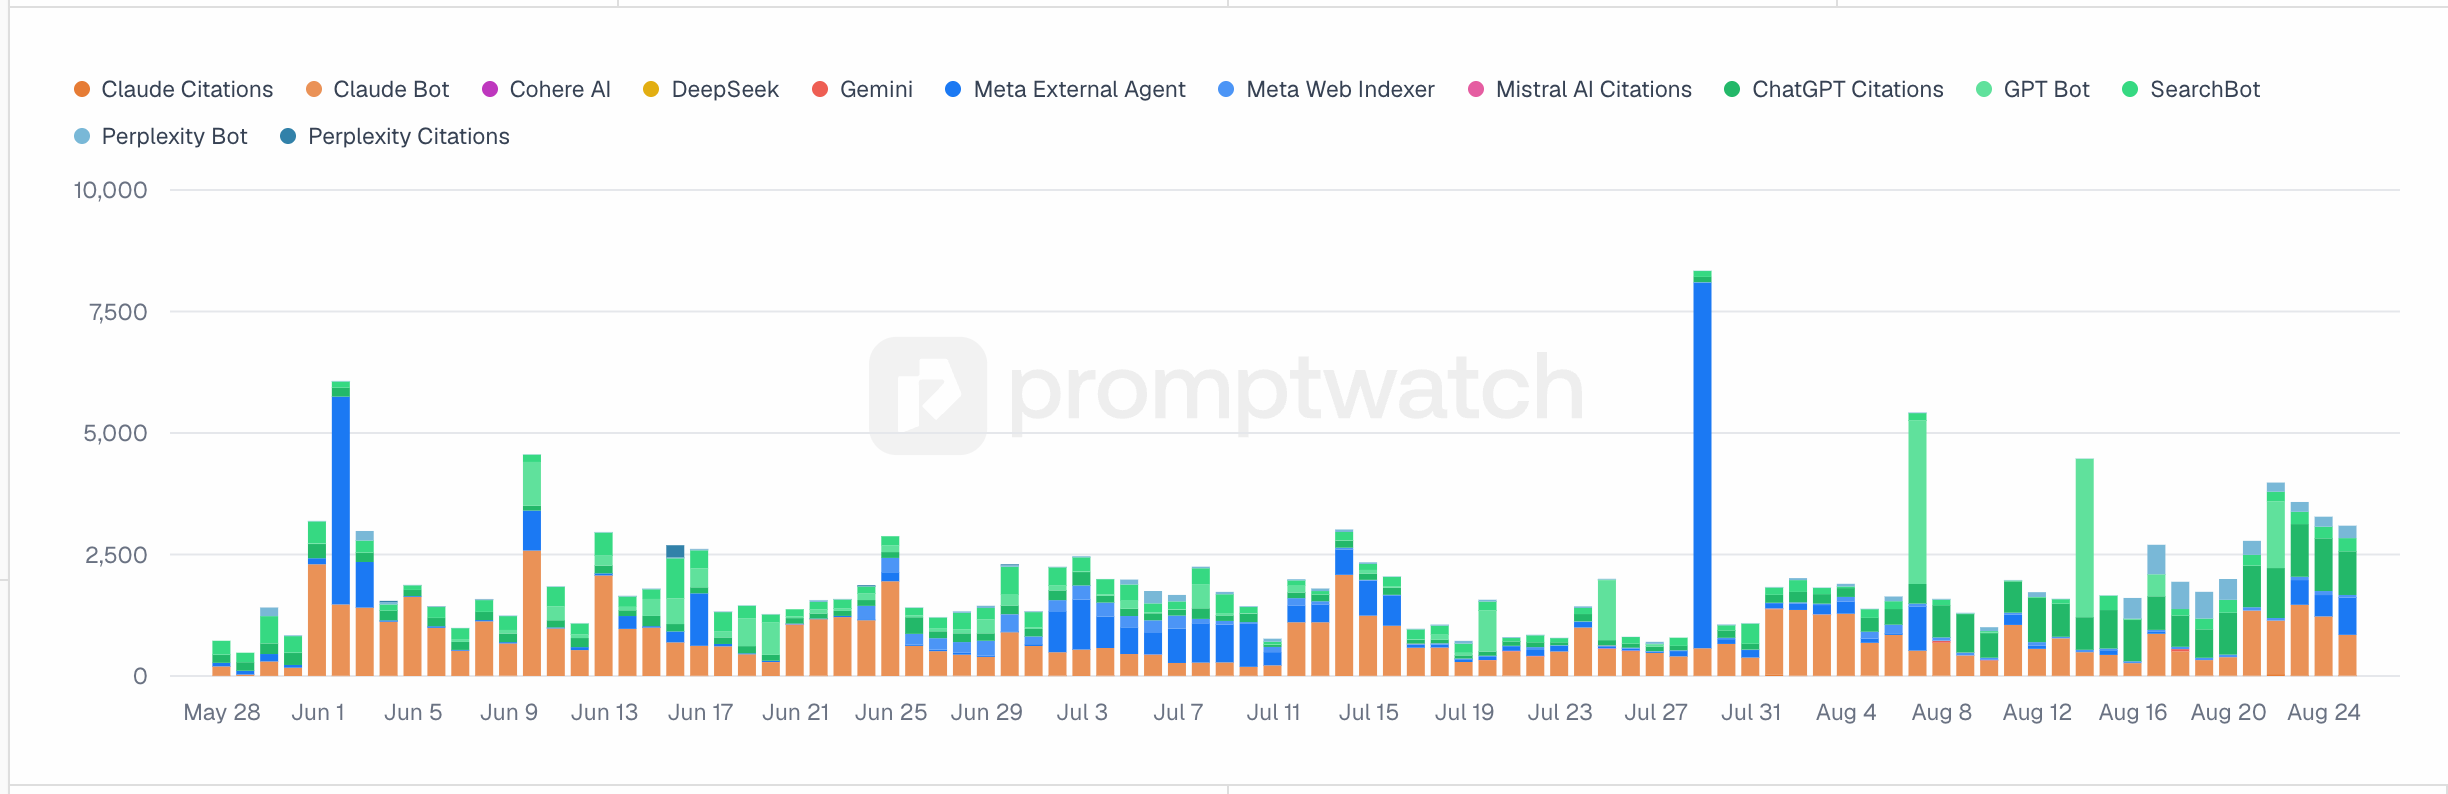
Log ingestion streams your server or CDN access logs to Promptwatch, so the platform can show you exactly when GPTBot, ClaudeBot, PerplexityBot, and other AI crawlers visit your site and which pages they fetch. This is the data source behind [AI crawler insights](/docs/academy/ai-crawler-insights).
### Why logs, and not a tracking script?
AI crawlers don't run JavaScript, so they're invisible to normal analytics tools. The only place their visits show up is your server's access logs. By sending those logs to Promptwatch, crawler activity becomes something you can chart, filter, and correlate with your visibility data: which pages get crawled most, whether crawl activity precedes citations, and which sections of your site the models ignore. For what to do with those answers, see [Crawler use cases](/docs/academy/crawler-use-cases) and [Turning crawler logs into opportunities](/docs/academy/crawler-logs-into-opportunities).
### How the setup works
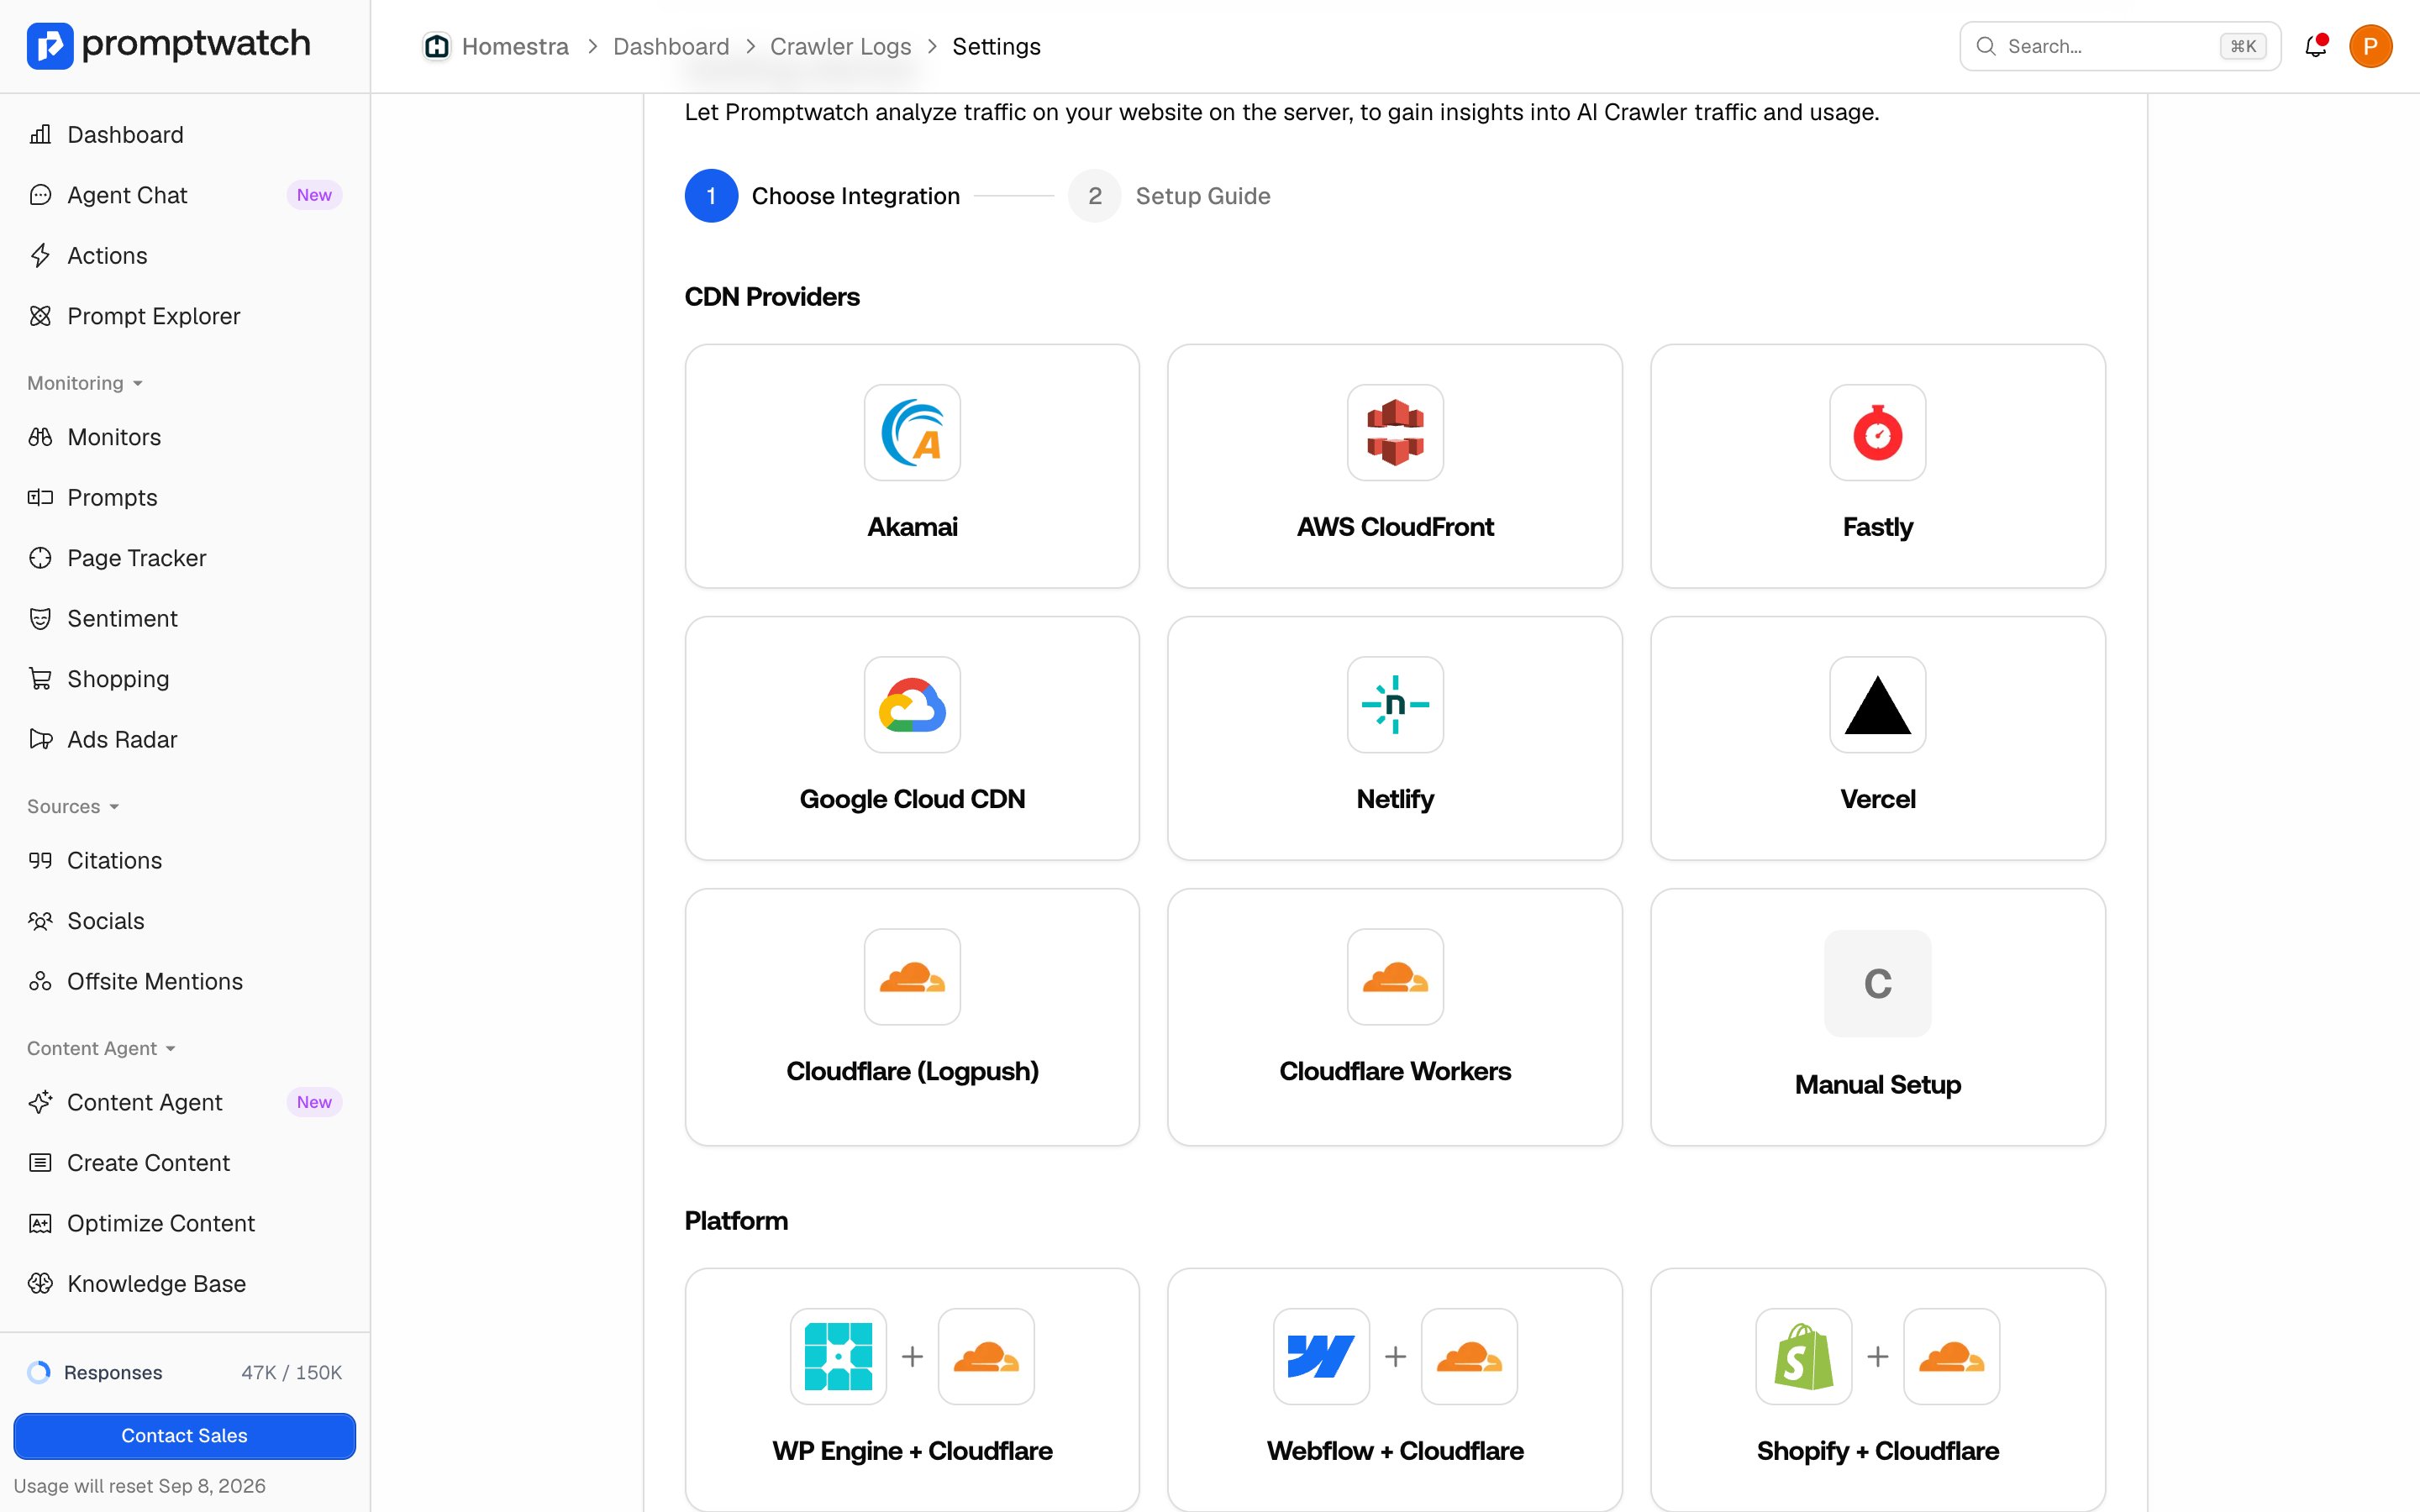
The setup is the same shape for every provider: create an API key, then configure your CDN or host to forward logs to Promptwatch's ingestion endpoint.
1. Go to **Settings → API Keys** in your project and create an API key. Each project needs its own key, so logs land in the right project.
2. Pick your CDN or platform and follow its guide in the [technical setup docs](/docs/crawler-logs/getting-started).
3. Send traffic. Crawler visits start appearing in Crawler Logs as logs flow in.
#### Supported providers
There's a step-by-step guide for each:
* **CDNs**: Cloudflare (Logpush, or a Worker if your plan doesn't include Logpush), Akamai, AWS CloudFront, Fastly, Google Cloud CDN, Netlify, and Vercel.
* **Platforms behind Cloudflare**: Webflow, Shopify, Kinsta, and WP Engine, each with a guide for putting Cloudflare in front and streaming from there.
* **Everything else**: a manual HTTP API, so any server or pipeline that can POST JSON can send logs.
 Promptwatch keeps only what's relevant: requests whose user agent doesn't match a known AI crawler or search engine bot are dropped at ingestion, as are static assets, so your regular visitor traffic never accumulates in Promptwatch.
### Verified crawler data
Anyone can fake a user agent string, and scrapers routinely pretend to be GPTBot. For crawlers whose providers publish IP ranges, Promptwatch checks the client IP against those ranges. Requests that claim to be a known bot but come from unverified IPs are left out of your charts unless you explicitly include them. Counts can be lower than a naive user-agent count from your raw logs, and more accurate.
### After logs are flowing
Open Crawler Logs in the sidebar and you'll see crawler trends over time, top crawled pages, and per-crawler breakdowns. Give it a few days of data before drawing conclusions: crawl behavior is bursty, and a week of logs tells you far more than an hour. From there, the interesting work is cross-referencing: pages that get crawled but never cited are optimization candidates, and pages that are never crawled may have a [crawlability](/docs/academy/crawlability) problem.
Promptwatch keeps only what's relevant: requests whose user agent doesn't match a known AI crawler or search engine bot are dropped at ingestion, as are static assets, so your regular visitor traffic never accumulates in Promptwatch.
### Verified crawler data
Anyone can fake a user agent string, and scrapers routinely pretend to be GPTBot. For crawlers whose providers publish IP ranges, Promptwatch checks the client IP against those ranges. Requests that claim to be a known bot but come from unverified IPs are left out of your charts unless you explicitly include them. Counts can be lower than a naive user-agent count from your raw logs, and more accurate.
### After logs are flowing
Open Crawler Logs in the sidebar and you'll see crawler trends over time, top crawled pages, and per-crawler breakdowns. Give it a few days of data before drawing conclusions: crawl behavior is bursty, and a week of logs tells you far more than an hour. From there, the interesting work is cross-referencing: pages that get crawled but never cited are optimization candidates, and pages that are never crawled may have a [crawlability](/docs/academy/crawlability) problem.