> ## Documentation Index
> Fetch the complete documentation index at: https://promptwatch.com/docs/llms.txt
> Use this file to discover all available pages before exploring further.
# Creating a PDF report
> PDF reports turn your dashboard or a single monitor into a shareable document, with filters applied to the visibility, sentiment, and citation charts.
A PDF report is a snapshot of your project's performance, rendered as a document you can download, attach to an email, or drop into a client deck. Instead of screenshotting charts one by one, you pick a scope and a set of filters, and Promptwatch renders the full report for you in the background.
### What a report contains
There are two report types:
* **Dashboard report**: covers your whole project. It includes your score gauges, AI platform traffic, the brand visibility chart, brand sentiment over time, top cited domains, and the competitor visibility heatmap.
* **Monitor report**: visibility score, brand visibility, brand sentiment, top cited domains, and the competitor heatmap, scoped to a single monitor, so you can report on one market or language without the noise of the rest of your project. See [What is a Promptwatch Monitor](/docs/academy/what-is-a-monitor) if you're not using monitors to segment yet.
Visibility, sentiment, citations, and the heatmap use the filters you set when creating the report; AI platform traffic follows the date range only.
### How to create one
1. Open your project dashboard, or a monitor page for a monitor report.
2. Click the **Export** button (the PDF icon).
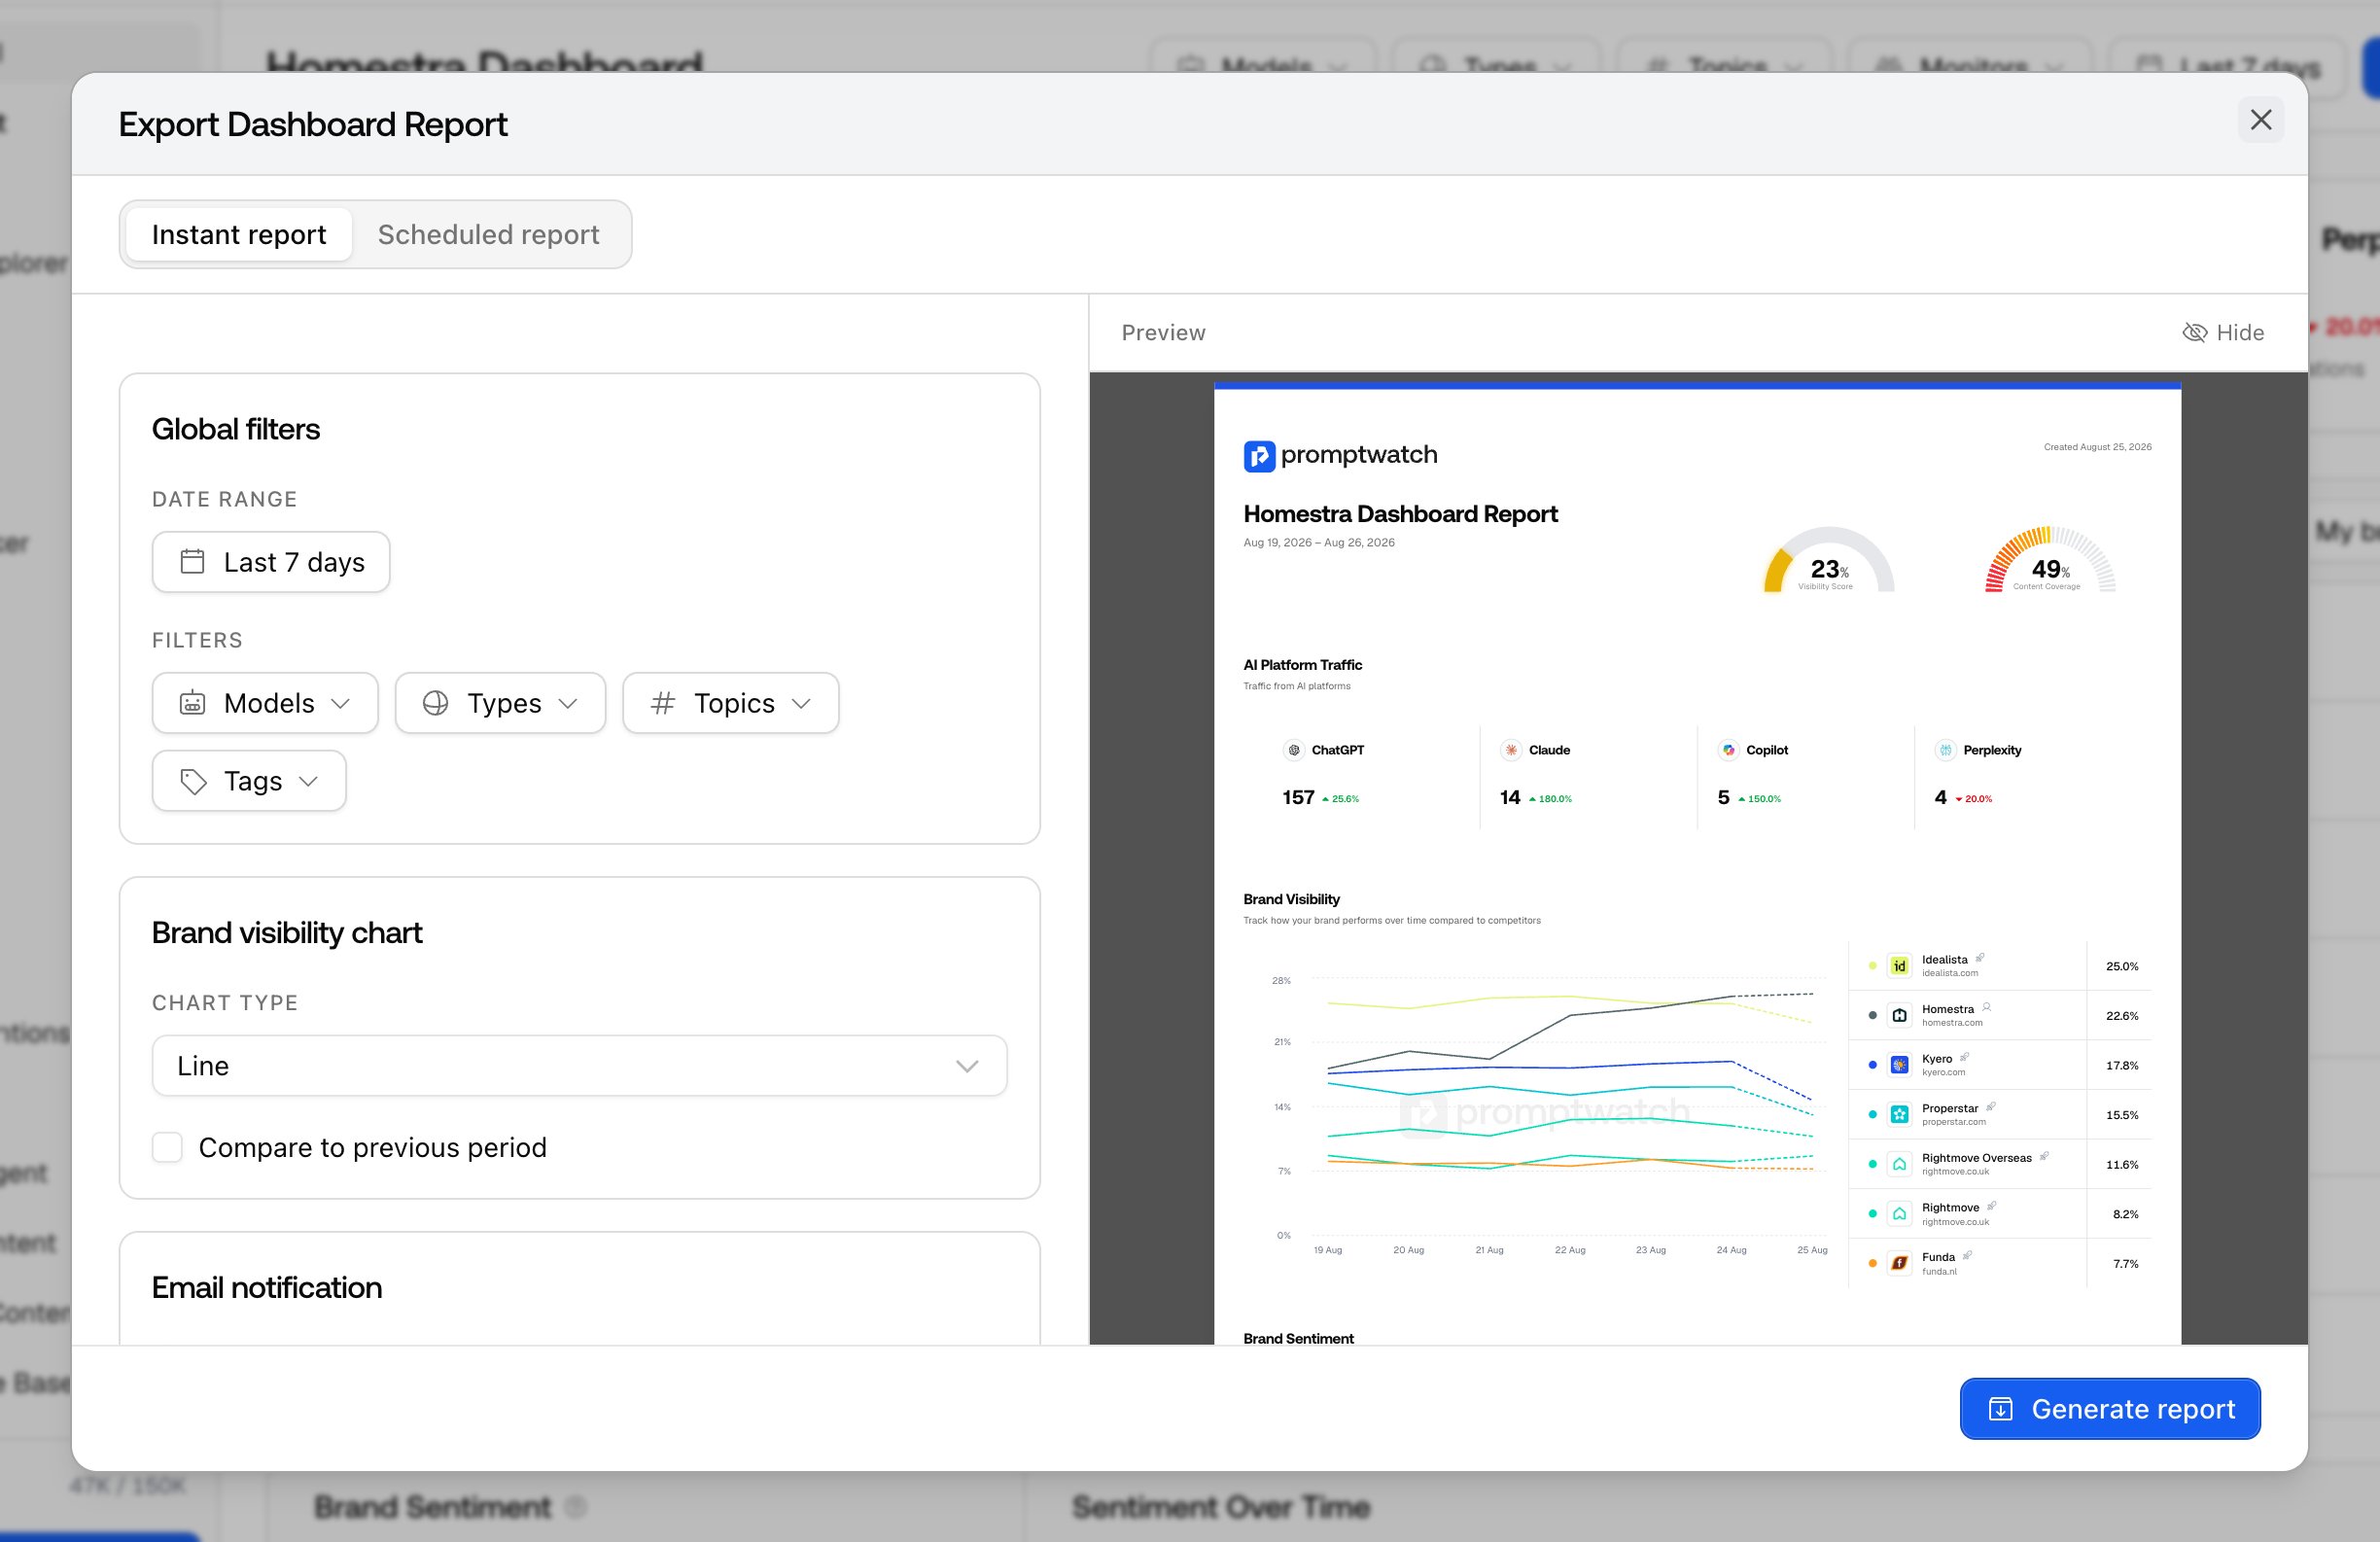
3. In the export modal, stay on the **Instant report** tab.
4. Adjust the filters and click **Generate report**.
#### Filters and options
* **Date range**: presets like last 7 or 30 days, or a custom range.
* **Global filters**: AI models, prompt types, topics, and tags. Monitor reports also let you filter by intent type.
* **Chart type**: choose how the brand visibility chart renders: bar, line, [share of voice](/docs/academy/share-of-voice), or rank.
* **Compare to previous period**: adds period-over-period comparison to the brand visibility chart.
* **Email notification**: check "Email me the PDF report once generated" and the finished PDF arrives in your inbox, so you don't have to wait around for larger reports.
The modal shows a live preview on the right, which is the actual report layout with your current filters applied. What you see there is what the PDF will contain.
 ### Where the report lands
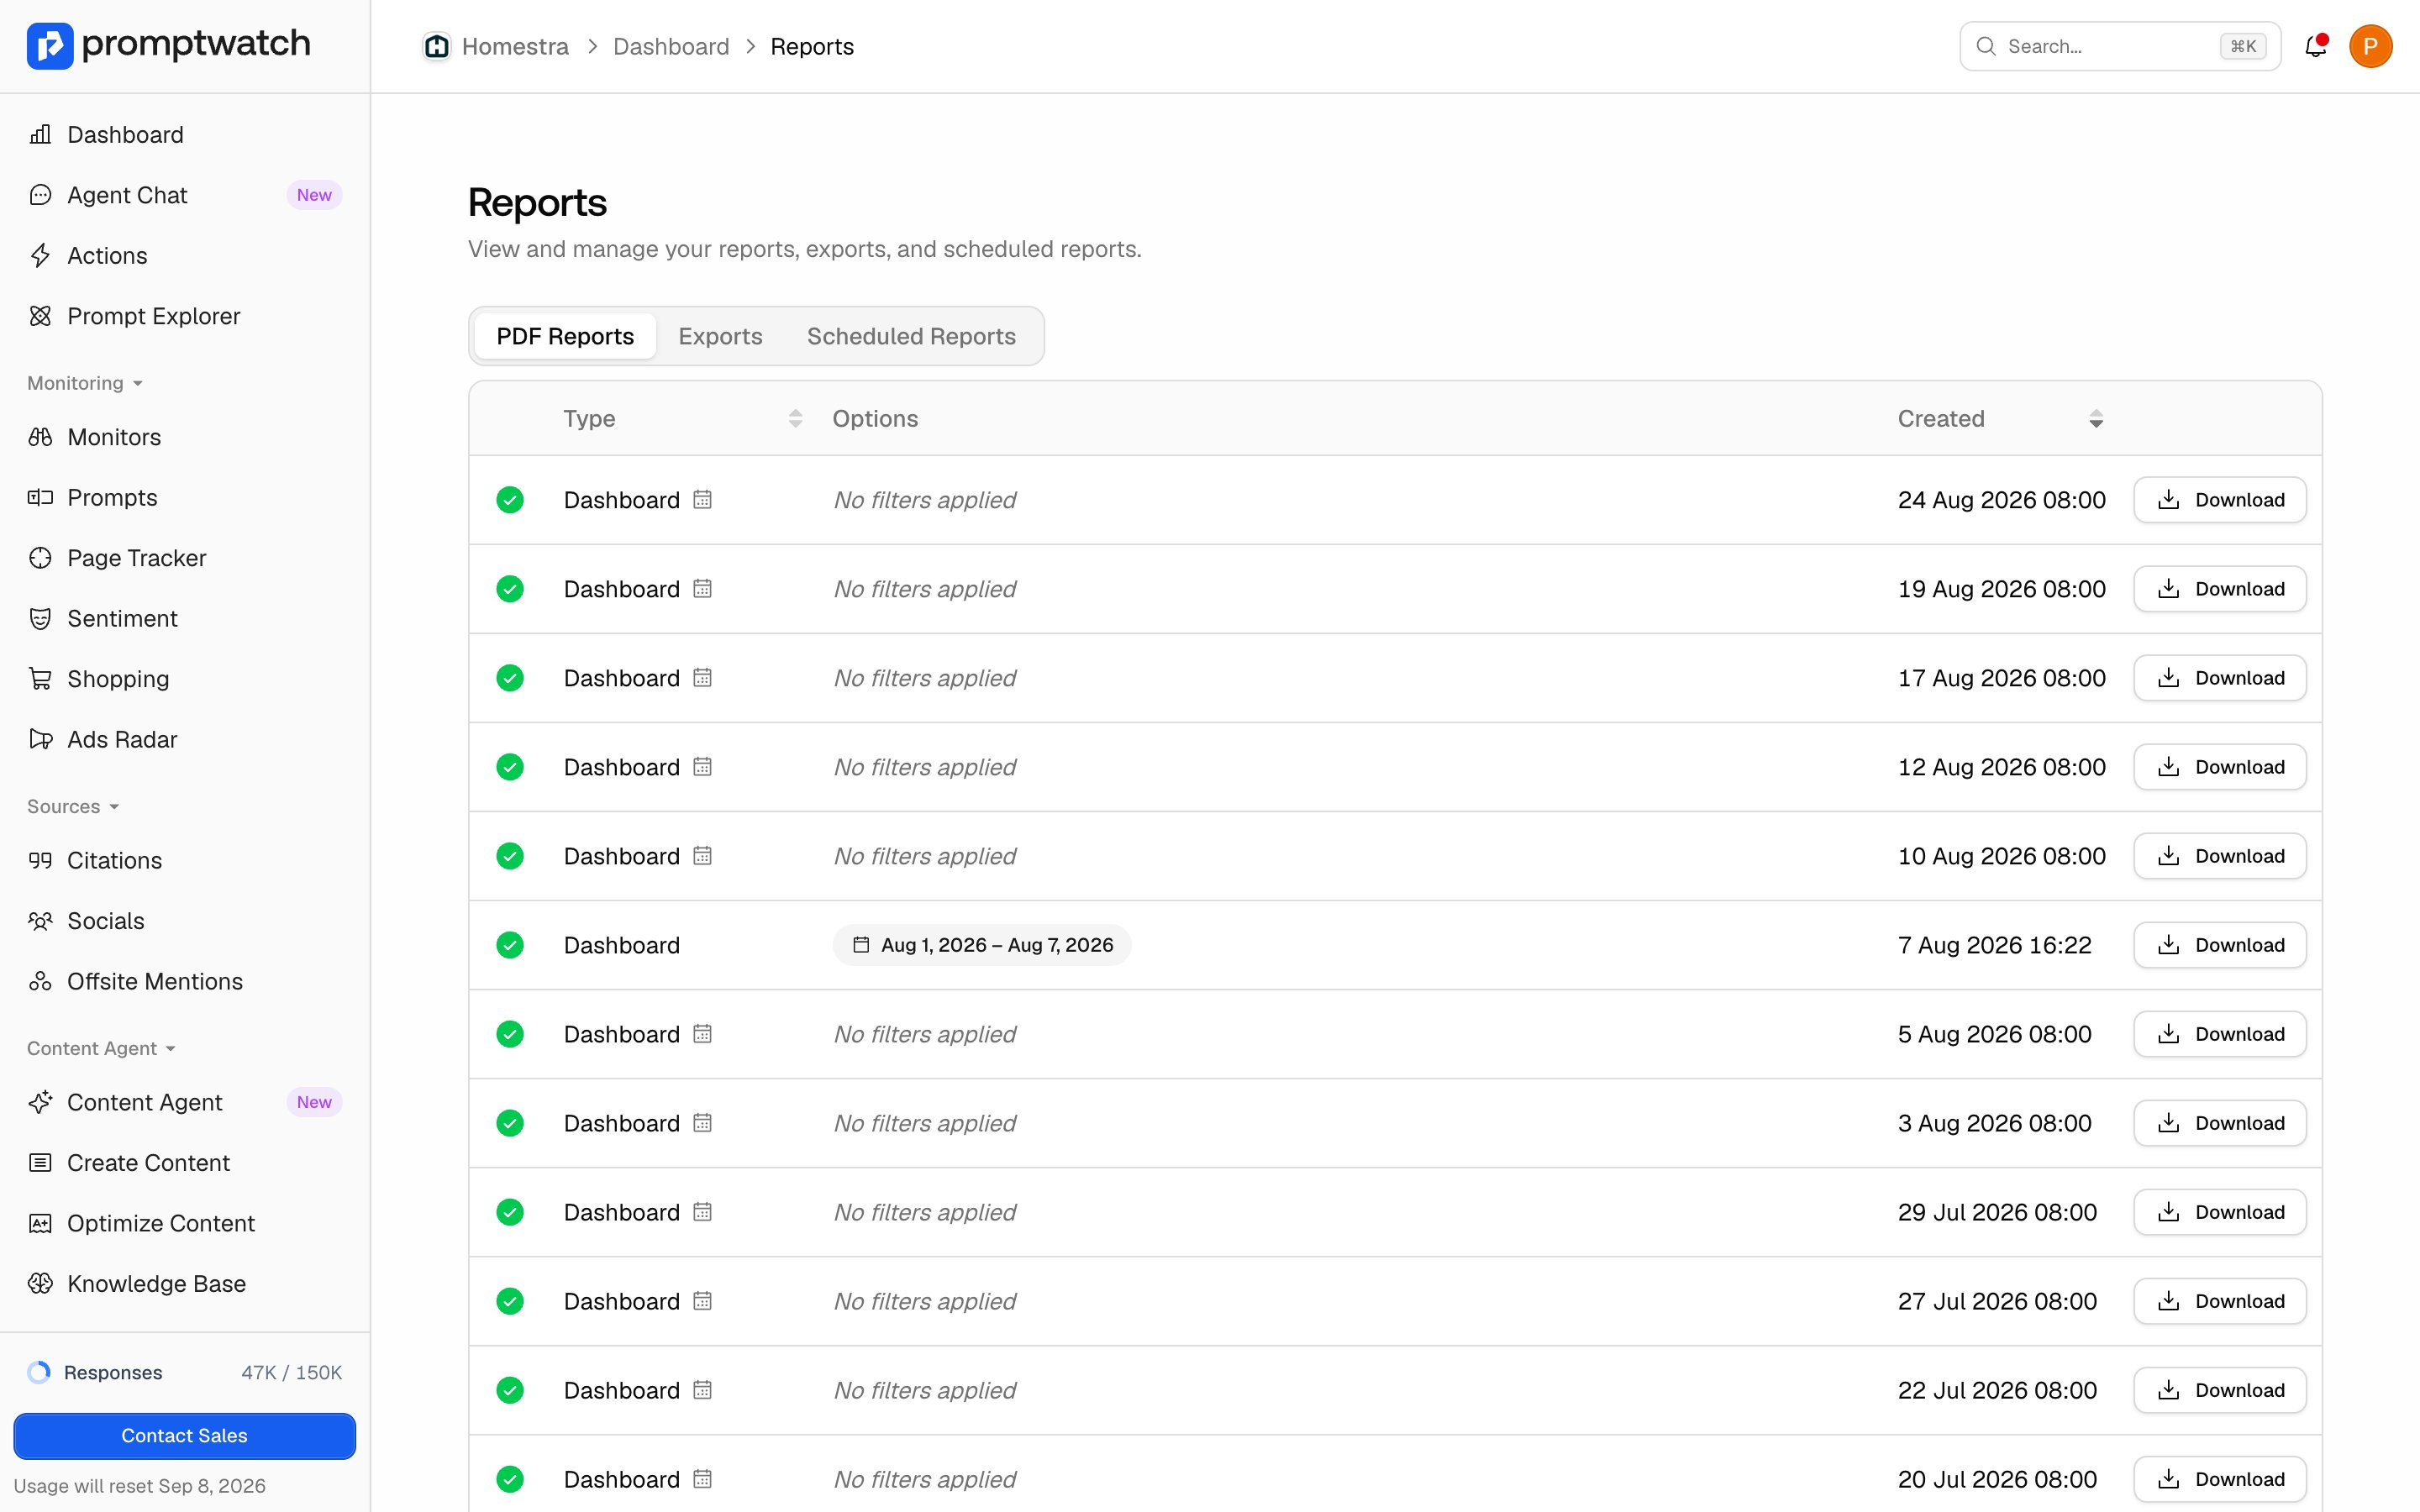
Reports generate in the background, so you can keep working while charts render. When it finishes, open **Reports** from the user menu (under Reporting), then the **PDF Reports** tab; a toast also links there. Each row shows the report type, the filters it was created with, and a **Download** button. Download links are refreshed automatically, so older reports stay downloadable.
### Where the report lands
Reports generate in the background, so you can keep working while charts render. When it finishes, open **Reports** from the user menu (under Reporting), then the **PDF Reports** tab; a toast also links there. Each row shows the report type, the filters it was created with, and a **Download** button. Download links are refreshed automatically, so older reports stay downloadable.
 A few practical limits:
* **Three at a time**: each project can have up to 3 reports generating at once. Wait for one to finish before queueing a fourth.
* **Plan availability**: PDF reports are available on Professional and above. On plans without them, **Generate report** opens an upgrade prompt.
### Other ways to generate reports
If you've connected Promptwatch to Claude or another AI assistant through [MCP](/docs/academy/mcp), you can ask it to generate a report for you: it uses the same report engine and returns a download link.
After your first report, consider putting it on a schedule so stakeholders get a fresh PDF every week without you touching the export modal. See [Scheduling and sharing reports](/docs/academy/sharing-reports).
A few practical limits:
* **Three at a time**: each project can have up to 3 reports generating at once. Wait for one to finish before queueing a fourth.
* **Plan availability**: PDF reports are available on Professional and above. On plans without them, **Generate report** opens an upgrade prompt.
### Other ways to generate reports
If you've connected Promptwatch to Claude or another AI assistant through [MCP](/docs/academy/mcp), you can ask it to generate a report for you: it uses the same report engine and returns a download link.
After your first report, consider putting it on a schedule so stakeholders get a fresh PDF every week without you touching the export modal. See [Scheduling and sharing reports](/docs/academy/sharing-reports).