> ## Documentation Index
> Fetch the complete documentation index at: https://promptwatch.com/docs/llms.txt
> Use this file to discover all available pages before exploring further.
# Reading Your Dashboard
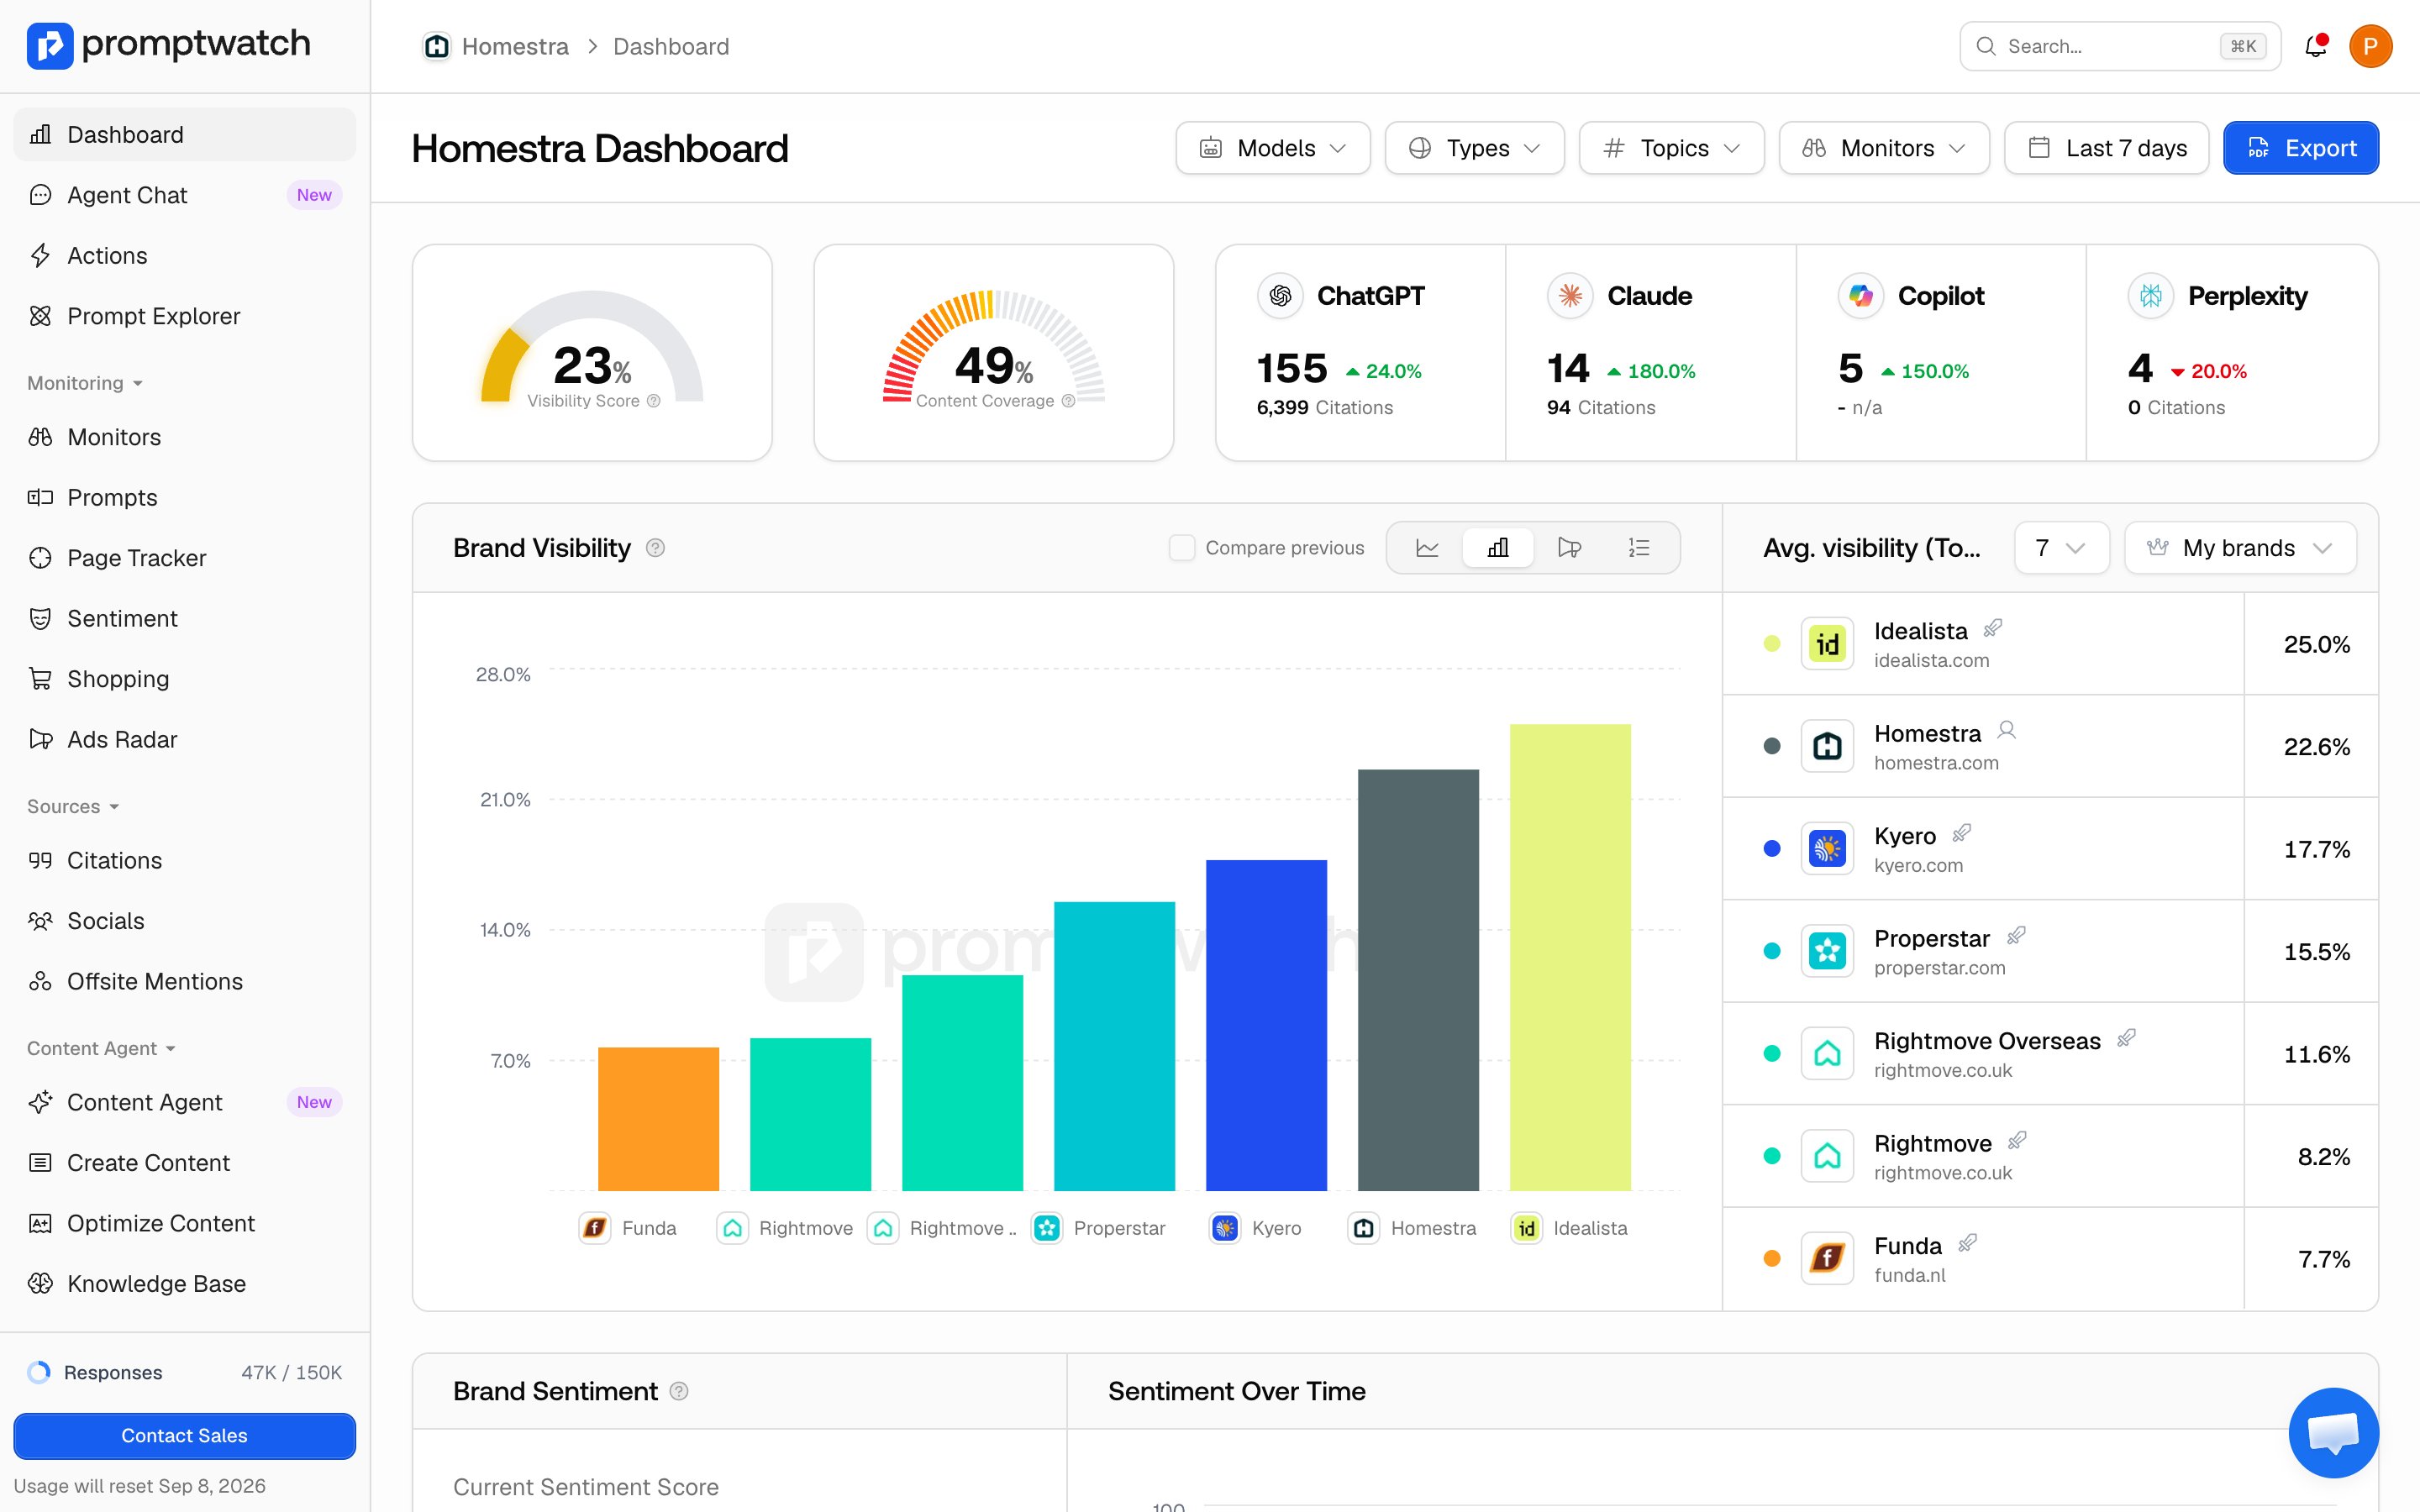
> The project dashboard shows your AI visibility at a glance: score gauges, visitor stats, the brand visibility chart, sentiment, top sources, and the competitor heatmap.
The project dashboard is the first page you land on inside a project, and every widget on it answers one specific question. This page walks the dashboard top to bottom so you know which widget to read for which question.
One thing to know before you scroll: the filter bar at the top (models, prompt types, topics, monitors, and the date range) drives the Visibility Score, the Brand Visibility chart, sentiment, the source widgets, and the heatmap. Content Coverage follows the prompt-type filter only, not the date range, and the visitor cards follow the date range only. The Export button turns the current view into a shareable report.
### The score gauges: how am I doing overall?
* **Visibility Score**: your 0-100 average across all analyzed responses in the period, where responses that don't mention you count as zero. This is your headline number. See [Visibility Score](/docs/academy/visibility-score) for how it's calculated.
* **Content Coverage**: how well your website answers the questions behind your tracked prompts. A low score here means AI models want to discuss topics your site doesn't cover yet. See [Content Gap](/docs/academy/content-gap).
### The visitor cards: is AI visibility becoming traffic?
The row of platform cards (ChatGPT, Claude, Copilot, Perplexity) shows the human side: visitors who clicked through to your site from each AI platform, with the change against the previous period, plus a citation count from your crawler logs where available. These cards need [visitor analytics](/docs/academy/visitor-analytics) and [crawler log](/docs/academy/ai-crawler-insights) setup; until then they show placeholder data with setup links.
 ### The Brand Visibility chart: who is winning, and is it changing?
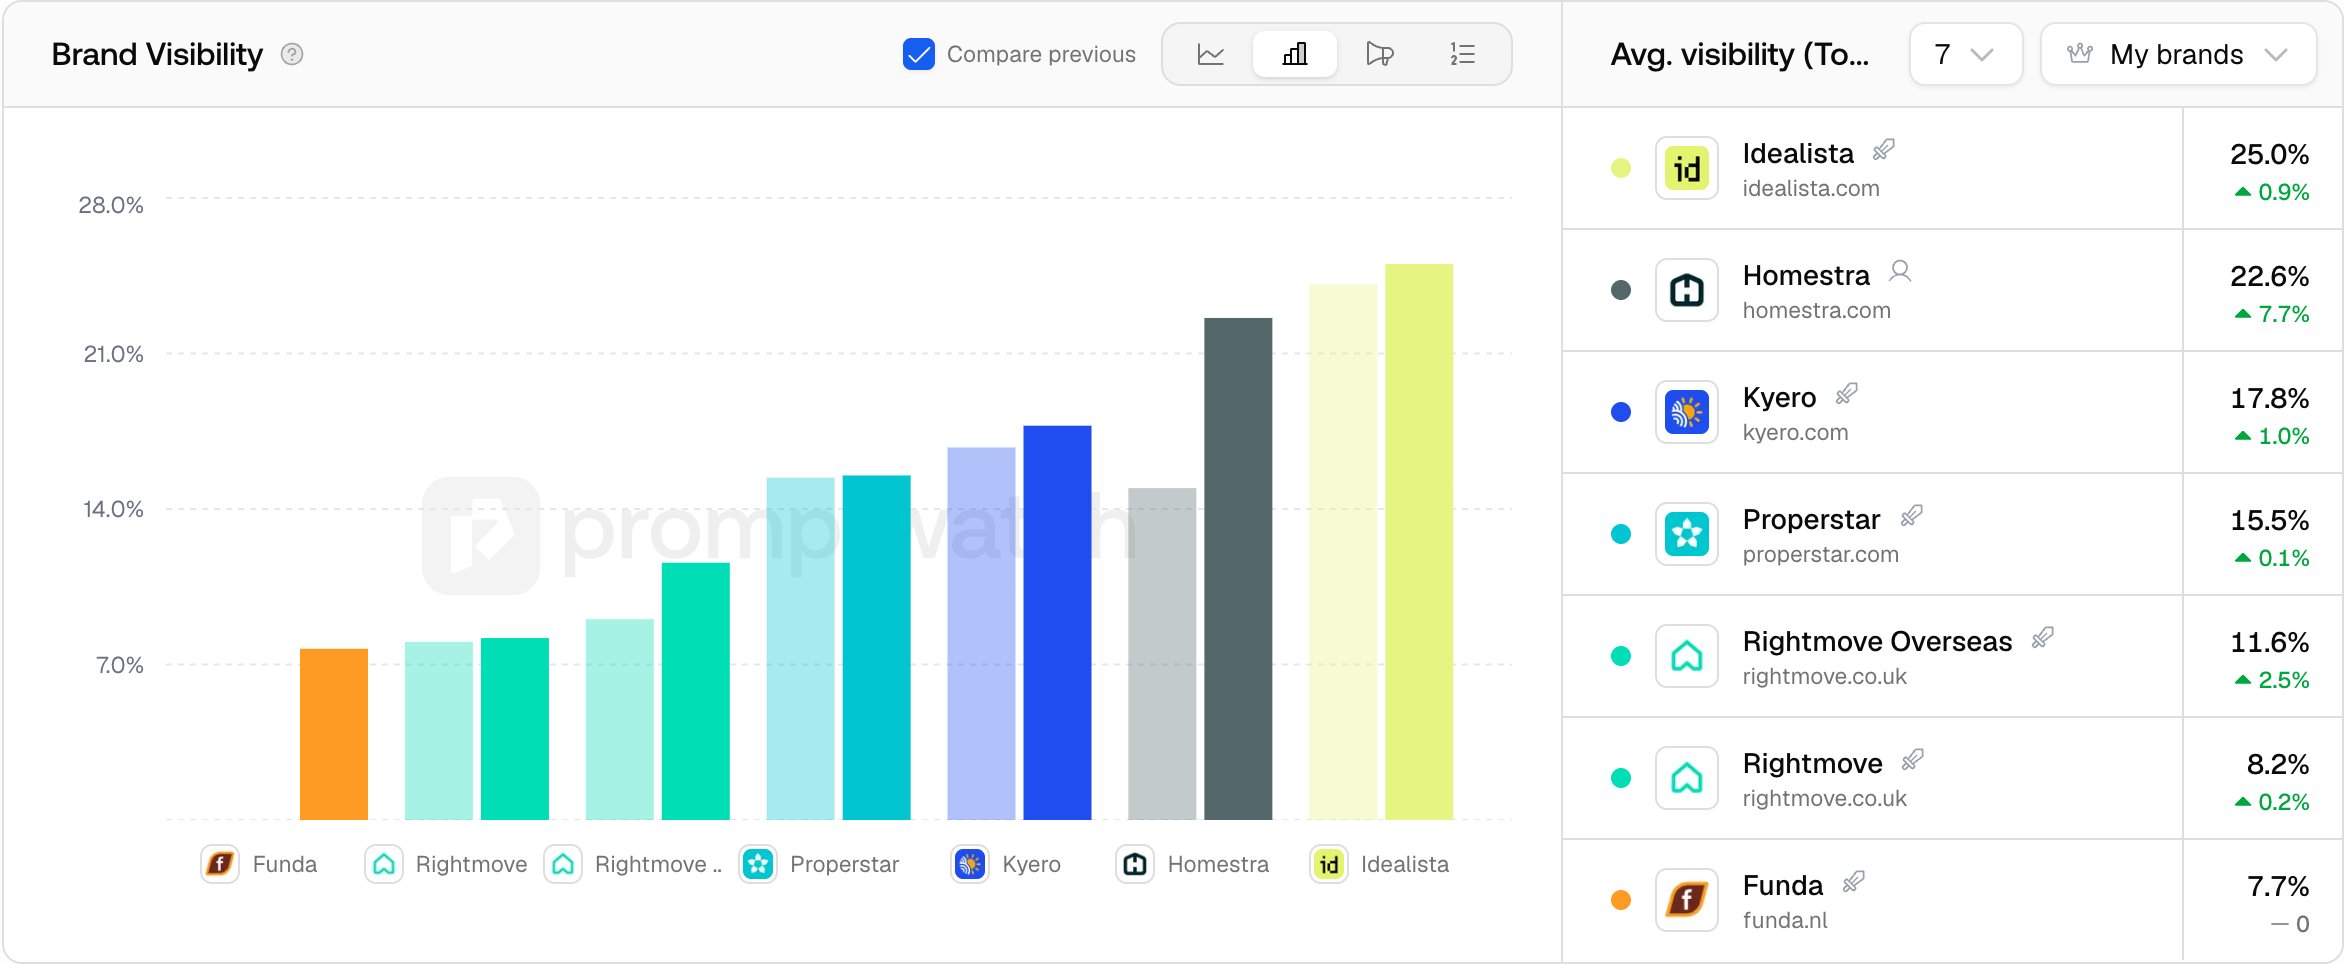
The main chart compares your brand against detected competitors, with a brand list beside it showing each brand's numbers for the period. It has four views, switchable with the tabs in the header:
* **Line**: visibility over time per brand, the view for spotting trends and sudden drops.
* **Bar**: average visibility per brand for the whole period, the view for a ranking snapshot.
* **Share of Voice** (the megaphone icon): each brand's share of total mentions, so you see who owns the conversation. See [Share of Voice](/docs/academy/share-of-voice).
* **Rank** (the numbered list icon): brands ordered by average [position in answer](/docs/academy/position-in-answer).
On Line and Bar, tick "Compare previous" to overlay the preceding period of the same length, which turns "is 42 good?" into "42, up from 36". Share of Voice and Rank don't overlay the previous period on the chart; the brand list beside the chart still shows the comparison.
### The Brand Visibility chart: who is winning, and is it changing?
The main chart compares your brand against detected competitors, with a brand list beside it showing each brand's numbers for the period. It has four views, switchable with the tabs in the header:
* **Line**: visibility over time per brand, the view for spotting trends and sudden drops.
* **Bar**: average visibility per brand for the whole period, the view for a ranking snapshot.
* **Share of Voice** (the megaphone icon): each brand's share of total mentions, so you see who owns the conversation. See [Share of Voice](/docs/academy/share-of-voice).
* **Rank** (the numbered list icon): brands ordered by average [position in answer](/docs/academy/position-in-answer).
On Line and Bar, tick "Compare previous" to overlay the preceding period of the same length, which turns "is 42 good?" into "42, up from 36". Share of Voice and Rank don't overlay the previous period on the chart; the brand list beside the chart still shows the comparison.
 ### Sentiment over time: how do models talk about me?
The sentiment chart tracks your 0-100 [sentiment score](/docs/academy/sentiment-score) across the period, next to your current score. Visibility tells you whether you appear; sentiment tells you whether the appearance helps. For per-attribute detail, open [Sentiment tracking](/docs/academy/sentiment-tracking).
### The source widgets: what is feeding the answers?
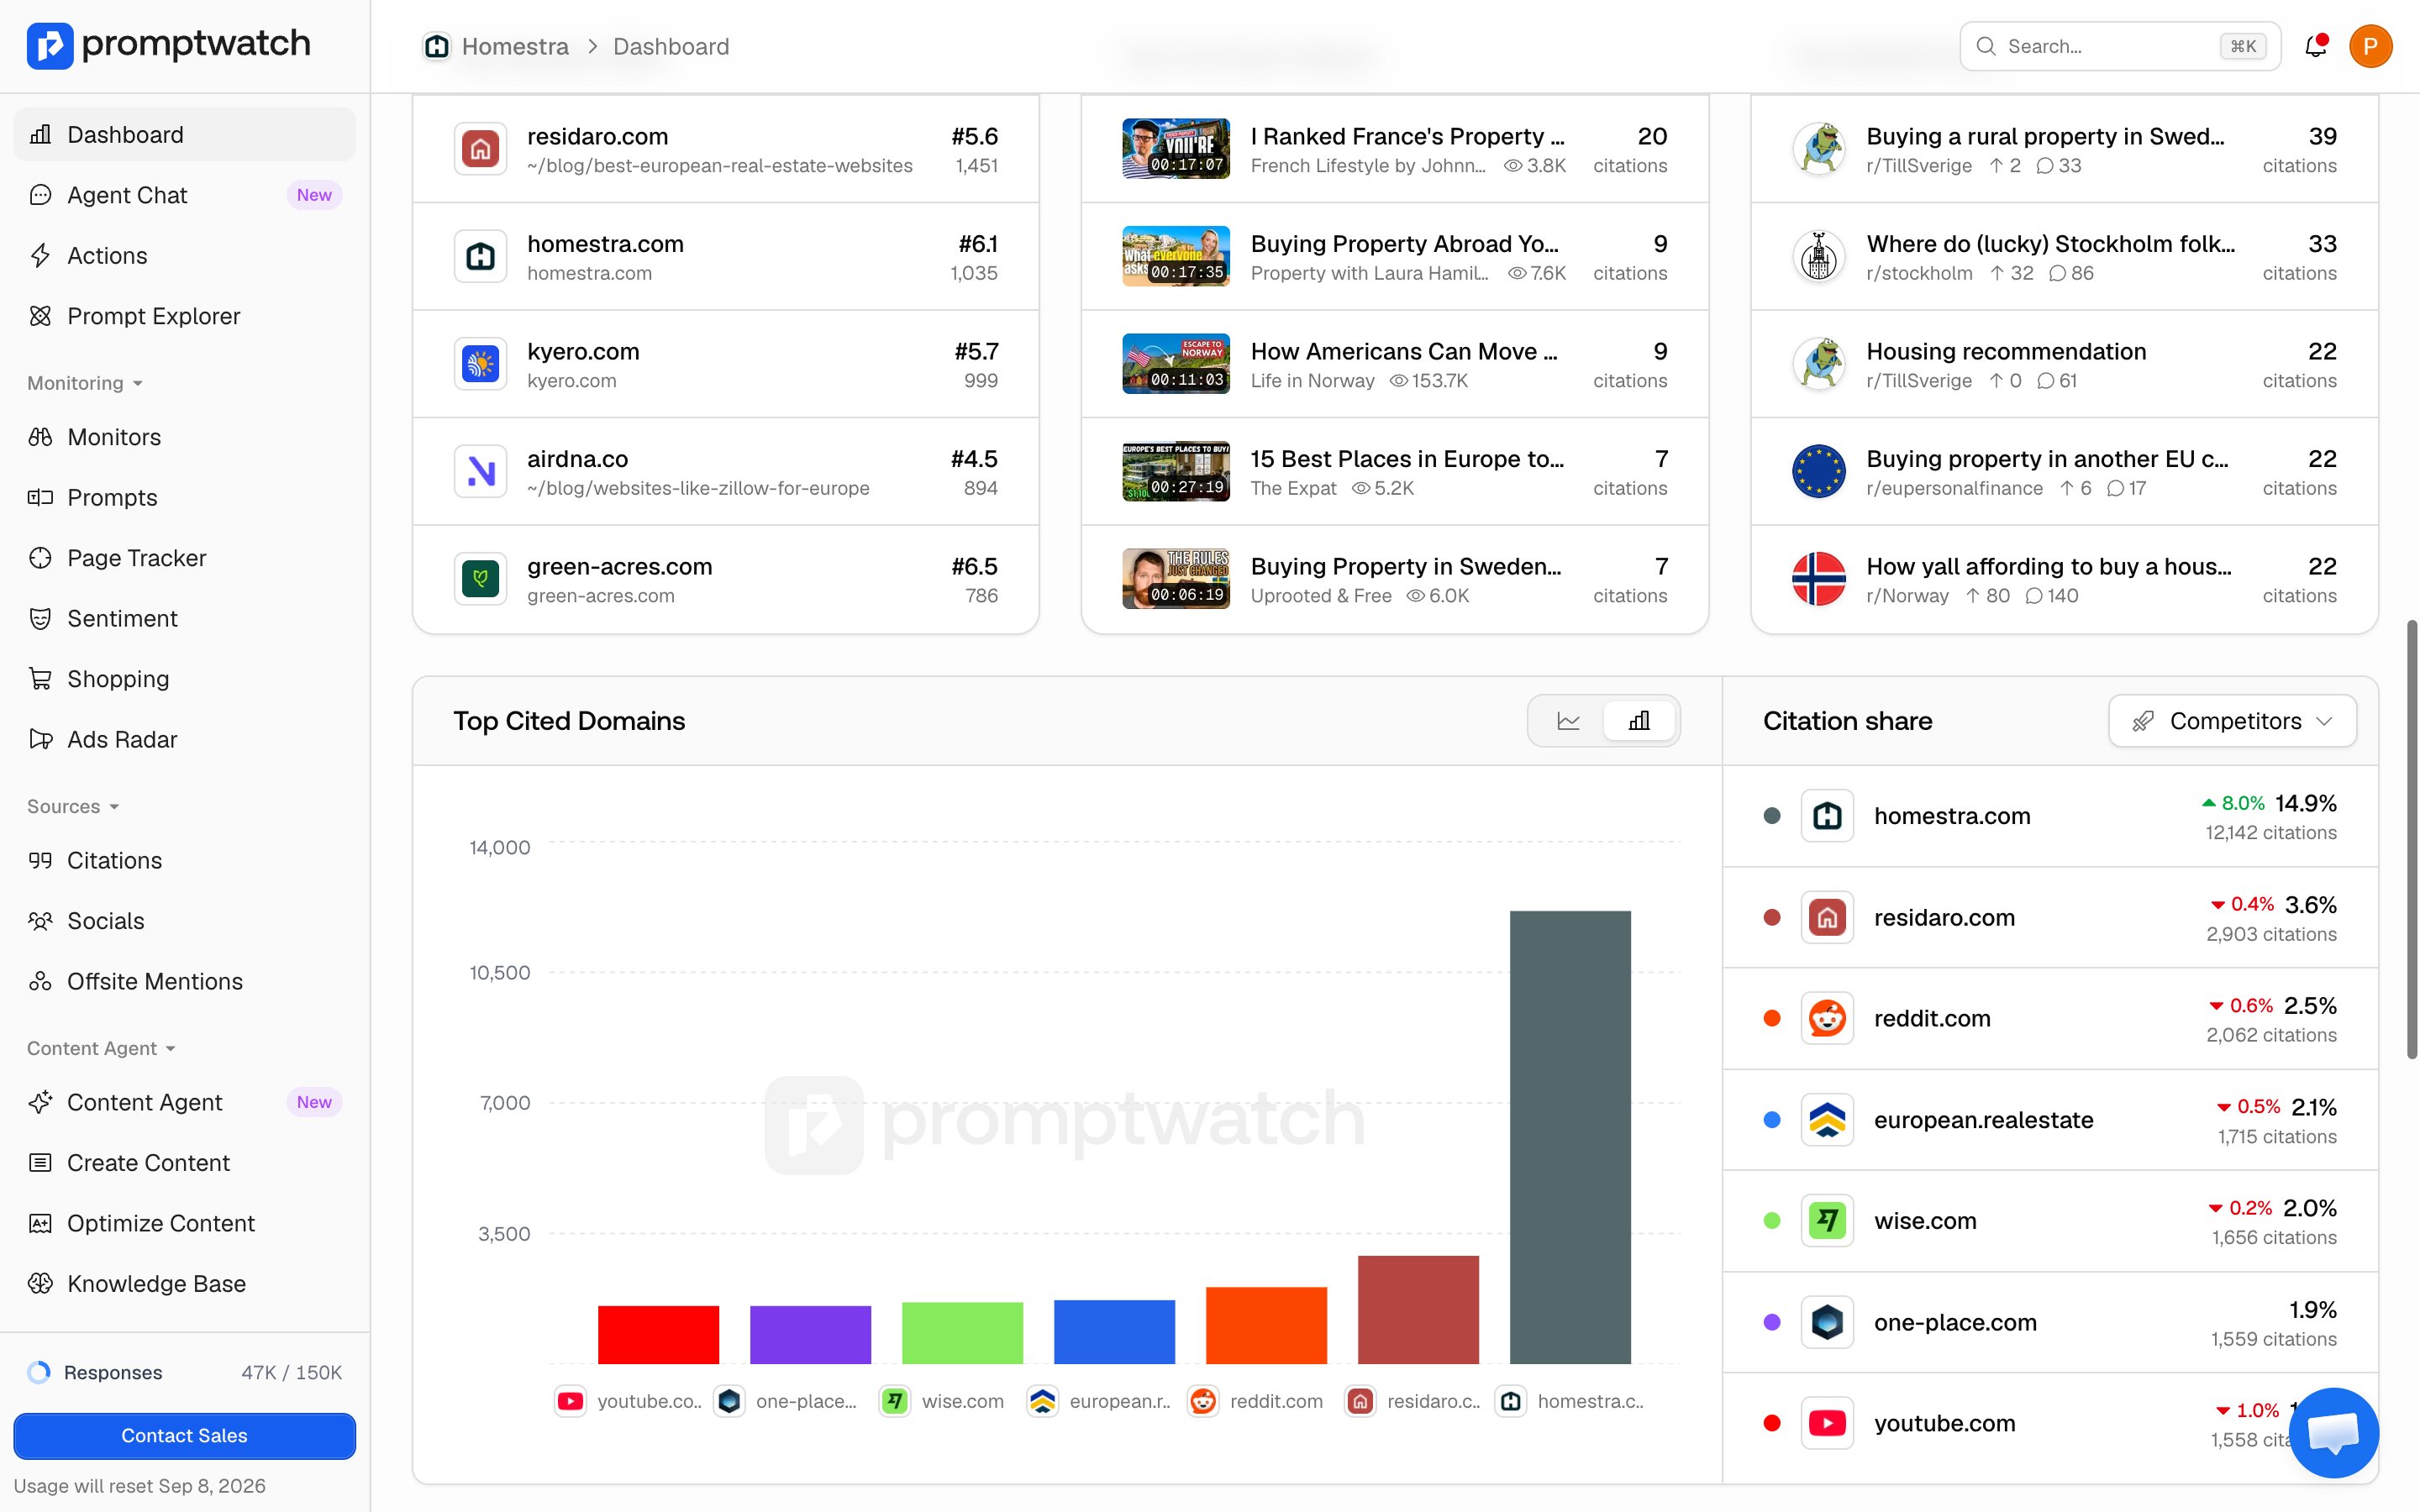
* **Top Ranked URLs**: the five most-cited pages across your responses, each with its average [citation rank](/docs/academy/citation-rank) and citation count. Click a URL to open its detail view.
* **Top YouTube Videos** and **Top Reddit Posts**: the videos and threads models cite most for your prompts, so you know where the community conversation lives. Detail pages: [YouTube citations](/docs/academy/source-types-youtube) and [Reddit citations](/docs/academy/source-types-reddit).
* **Top Cited Domains**: which domains earn citations over time, with a citation share list beside the chart. This is where you check whether your own domain is among the sources, covered in depth in [Using citations](/docs/academy/understanding-sources).
### Sentiment over time: how do models talk about me?
The sentiment chart tracks your 0-100 [sentiment score](/docs/academy/sentiment-score) across the period, next to your current score. Visibility tells you whether you appear; sentiment tells you whether the appearance helps. For per-attribute detail, open [Sentiment tracking](/docs/academy/sentiment-tracking).
### The source widgets: what is feeding the answers?
* **Top Ranked URLs**: the five most-cited pages across your responses, each with its average [citation rank](/docs/academy/citation-rank) and citation count. Click a URL to open its detail view.
* **Top YouTube Videos** and **Top Reddit Posts**: the videos and threads models cite most for your prompts, so you know where the community conversation lives. Detail pages: [YouTube citations](/docs/academy/source-types-youtube) and [Reddit citations](/docs/academy/source-types-reddit).
* **Top Cited Domains**: which domains earn citations over time, with a citation share list beside the chart. This is where you check whether your own domain is among the sources, covered in depth in [Using citations](/docs/academy/understanding-sources).
 ### The Competitor Visibility Heatmap: where am I weak?
The heatmap at the bottom breaks visibility down per brand per model, because averages hide model-level problems: you can lead on ChatGPT and be invisible on Perplexity while your overall score looks fine. Reading and acting on it has its own page: [Competitors and the heatmap](/docs/academy/competitors-and-heatmap).
### After the first read
A useful habit: scan the gauges for level, the visibility chart for direction, and the heatmap for location. When something looks off, narrow the filters (one model, one monitor, one prompt type) until you can see which responses moved, then open them from the [Responses page](/docs/academy/understanding-responses).
### The Competitor Visibility Heatmap: where am I weak?
The heatmap at the bottom breaks visibility down per brand per model, because averages hide model-level problems: you can lead on ChatGPT and be invisible on Perplexity while your overall score looks fine. Reading and acting on it has its own page: [Competitors and the heatmap](/docs/academy/competitors-and-heatmap).
### After the first read
A useful habit: scan the gauges for level, the visibility chart for direction, and the heatmap for location. When something looks off, narrow the filters (one model, one monitor, one prompt type) until you can see which responses moved, then open them from the [Responses page](/docs/academy/understanding-responses).