> ## Documentation Index
> Fetch the complete documentation index at: https://promptwatch.com/docs/llms.txt
> Use this file to discover all available pages before exploring further.
# Understanding Responses
> A response is one model's answer to one prompt on one scheduled run, and every Promptwatch metric is extracted from those answers.
### What is a response?
A response is one AI model's answer to one prompt on one scheduled run. If a monitor tracks 50 prompts across 4 models daily, it produces 200 responses a day. Each response stores the full answer text exactly as the model returned it, plus everything analysis extracts from it.
Responses are the atoms of Promptwatch. Every chart you see, visibility, [Share of Voice](/docs/academy/share-of-voice), sentiment, citations, is an aggregate over responses, so when a metric surprises you, the responses behind it are where you find out why.
### What gets extracted from a response
After a response arrives, it is analyzed, and the analysis pulls out several layers:
* **Brand mentions**: every brand discussed in the answer text, yours and competitors'. One mention per brand per response, however often the name appears, so mention counts read as "answers we appear in". Each mention of your brand carries a [visibility score](/docs/academy/visibility-score) and a [position in the answer](/docs/academy/position-in-answer), plus a sentiment score when the tone is determinable.
* **Citations**: the source URLs the model attached to its answer, recorded with domain and position among the sources. Promptwatch distinguishes sources cited inline in the text, sources listed in a footnote, and pages the model browsed during search without citing directly. Citations only appear reliably on live-search models; a training-data answer with zero citations is normal. See [Citations vs. mentions](/docs/academy/citations-vs-mentions).
* **Sentiment**: a 0-100 score for how positively the response discusses your brand, scored independently of how visible you are. See [Sentiment score](/docs/academy/sentiment-score).
* **Enrichments**: structured extras the model returned alongside the text: entity cards, shopping results, news items, or ads. These matter because a shopping carousel or ad can shape the answer more than the prose does.
* **Query fanouts**: the sub-queries the model actually searched while composing the answer, which often differ from the prompt you asked. See [Query fanouts](/docs/academy/query-fanouts).
### Reading the responses list
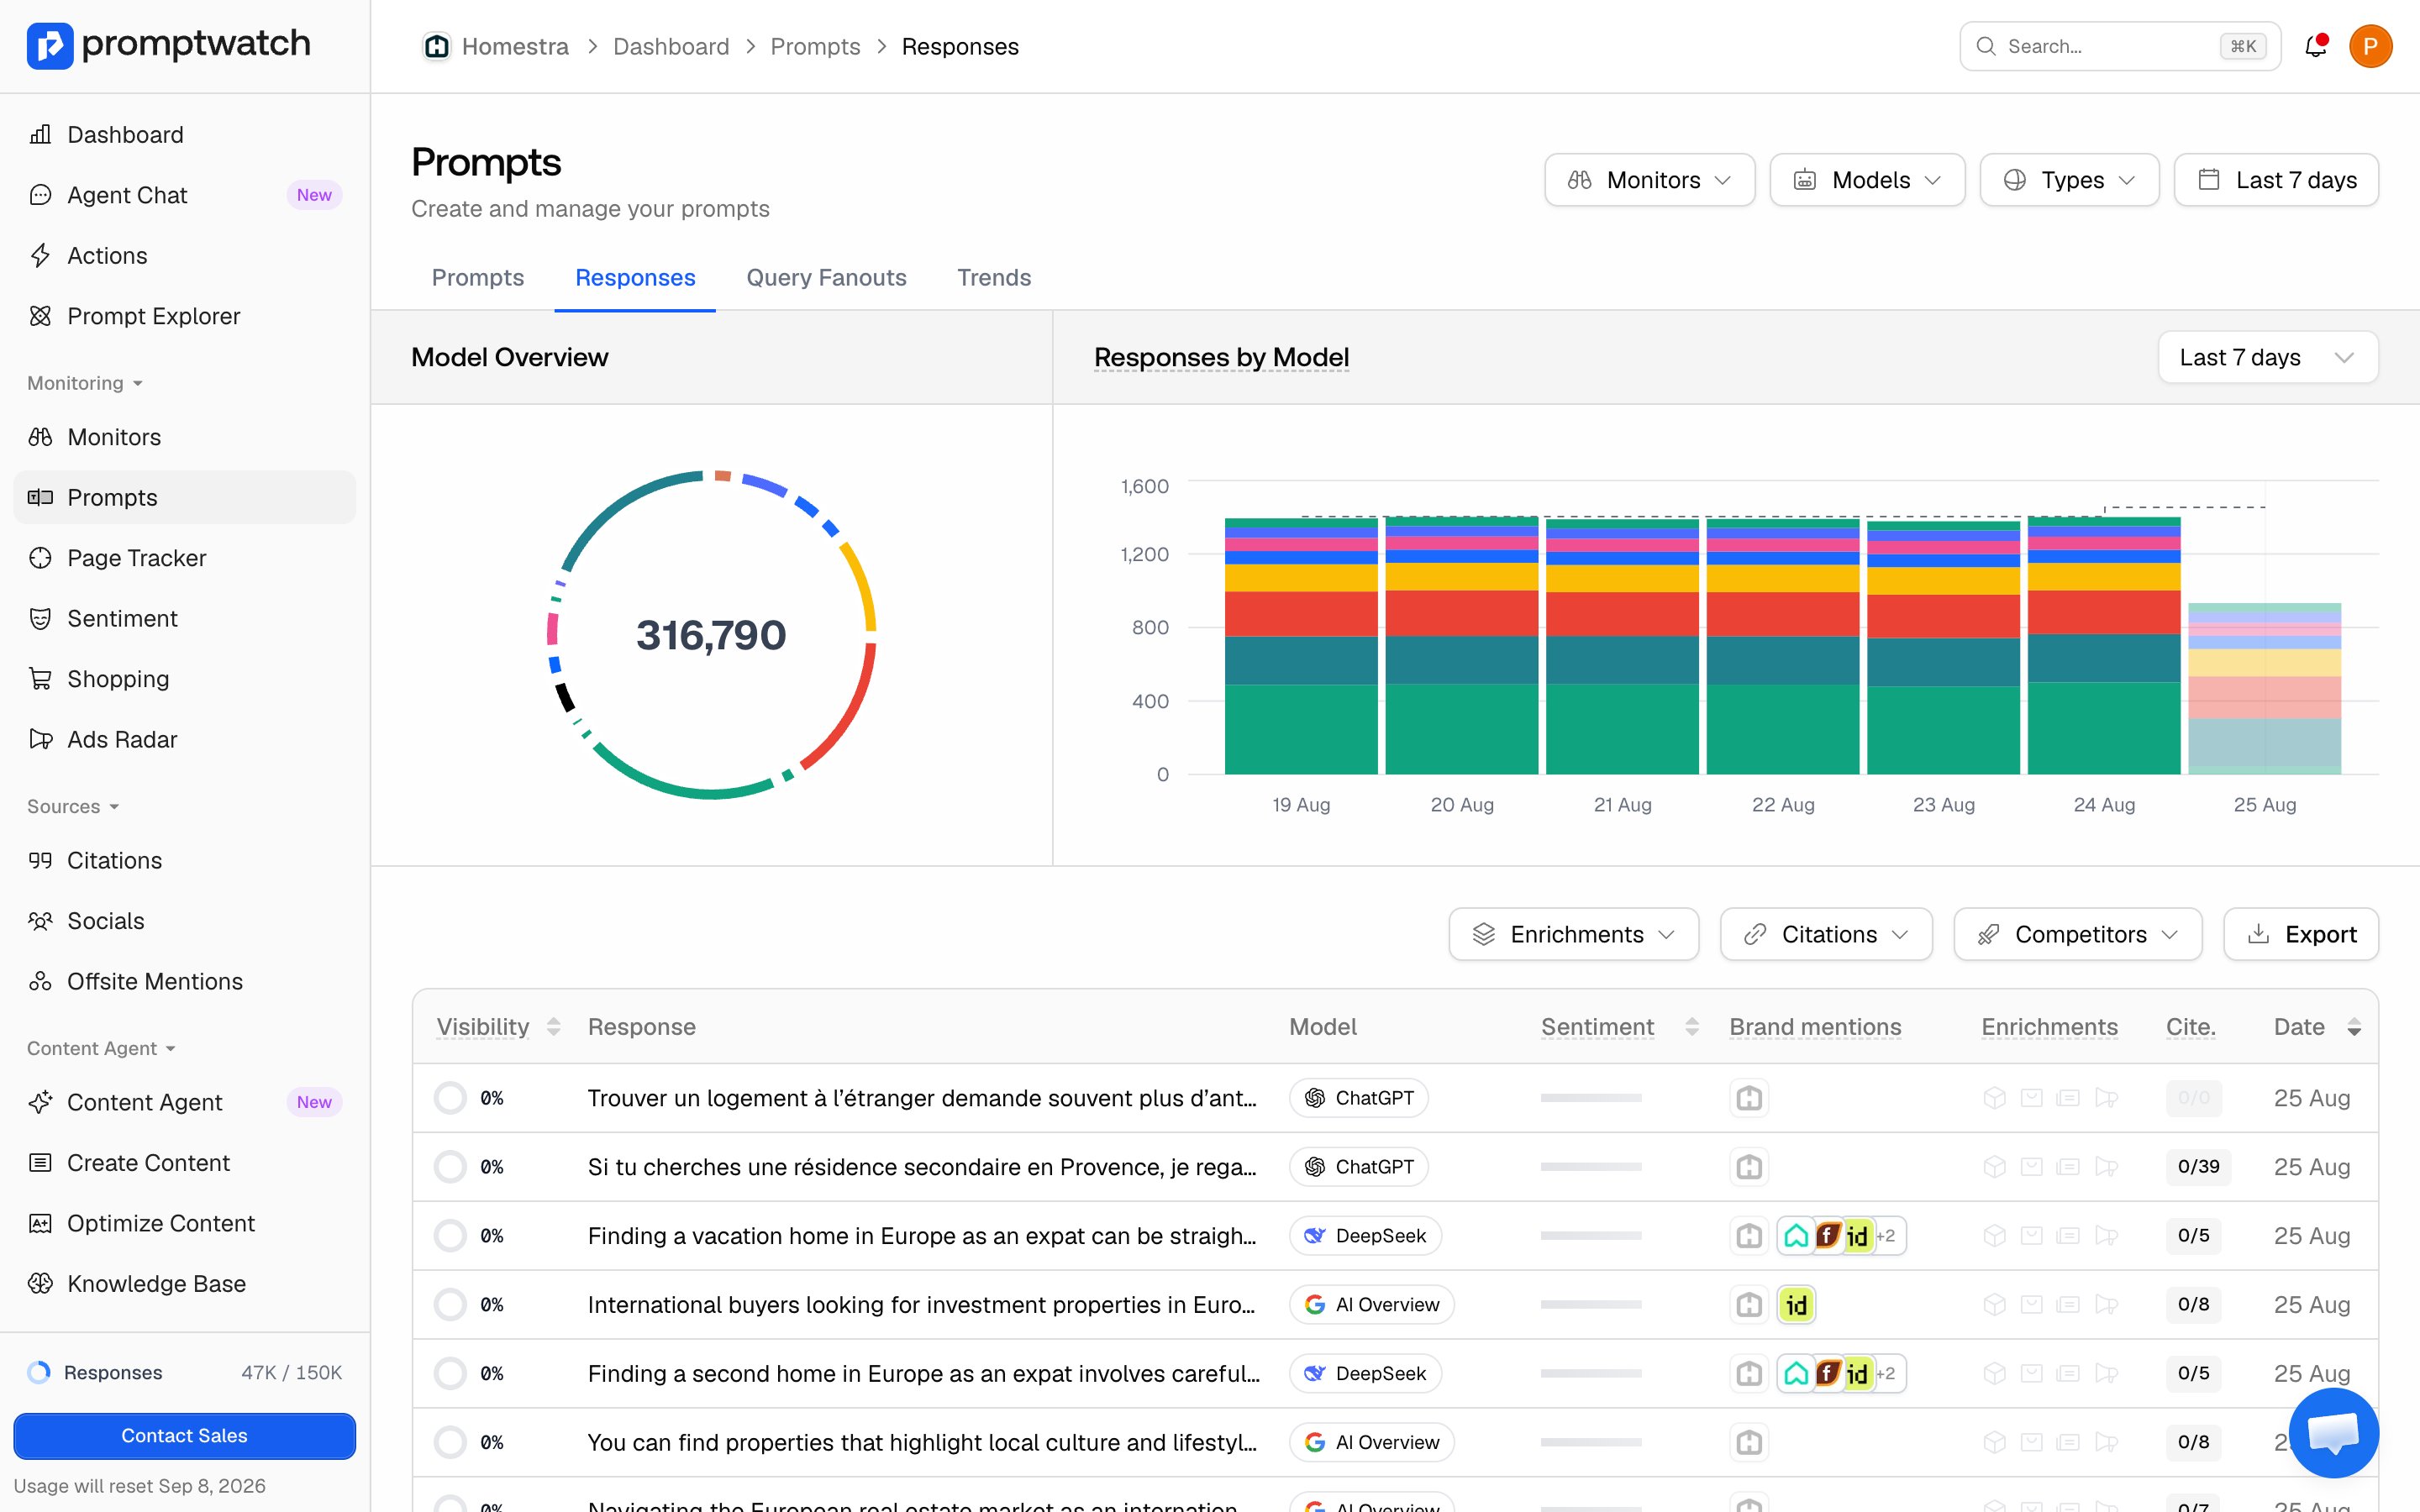
The Responses page (under Prompts in the sidebar) lists every response in the selected date range, topped by two charts: the model distribution of your responses and response volume over time per model. Each row shows the extraction results at a glance:
* **Visibility**: the response's score for your brand, zero meaning you didn't appear.
* **Response**: a preview of the answer text.
* **Model**, **Sentiment**, and **Date**.
* **Brand mentions**: which brands appeared, with yours marked.
* **Enrichments**: icons for entities, shopping, news, and ads detected in the response.
* **Cite.**: your self-citations against the total citations, so "0/12" means twelve sources and none of them yours.
Filter the list by enrichment type, citations, mentioned brand, model, or prompt type to isolate a slice, for example "responses where a competitor is mentioned and I have no citation". The Export button downloads the current slice as a file; see [exporting responses](/docs/academy/exporting-your-data).
 ### Reading a single response
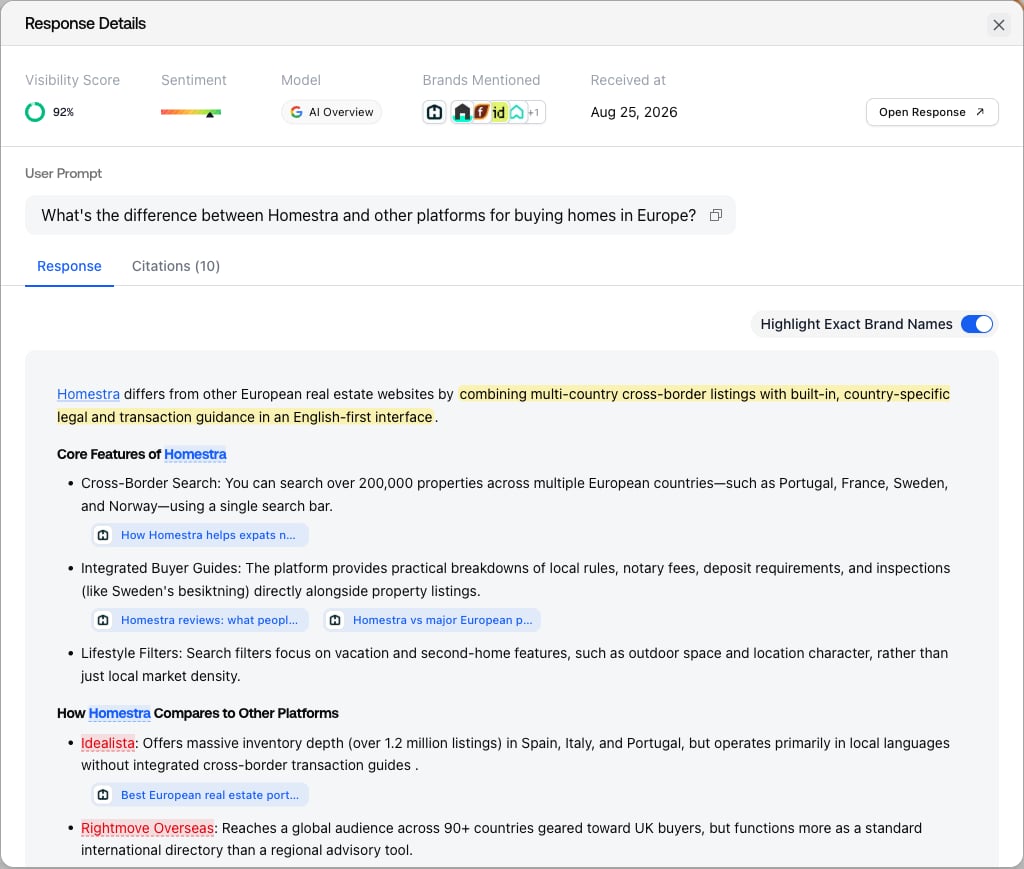
Click a row to open the response detail. The header repeats the key stats (visibility, sentiment, model, brands mentioned, received time) above the exact prompt that was asked and, when the monitor uses one, the persona it ran under. Below that, tabs:
* **Response**: the full answer, always there. When brands were detected, toggle "Highlight Exact Brand Names" to mark them in the text; on models other than AI Overview, toggle "View Markdown" for the stored markdown.
### Reading a single response
Click a row to open the response detail. The header repeats the key stats (visibility, sentiment, model, brands mentioned, received time) above the exact prompt that was asked and, when the monitor uses one, the persona it ran under. Below that, tabs:
* **Response**: the full answer, always there. When brands were detected, toggle "Highlight Exact Brand Names" to mark them in the text; on models other than AI Overview, toggle "View Markdown" for the stored markdown.
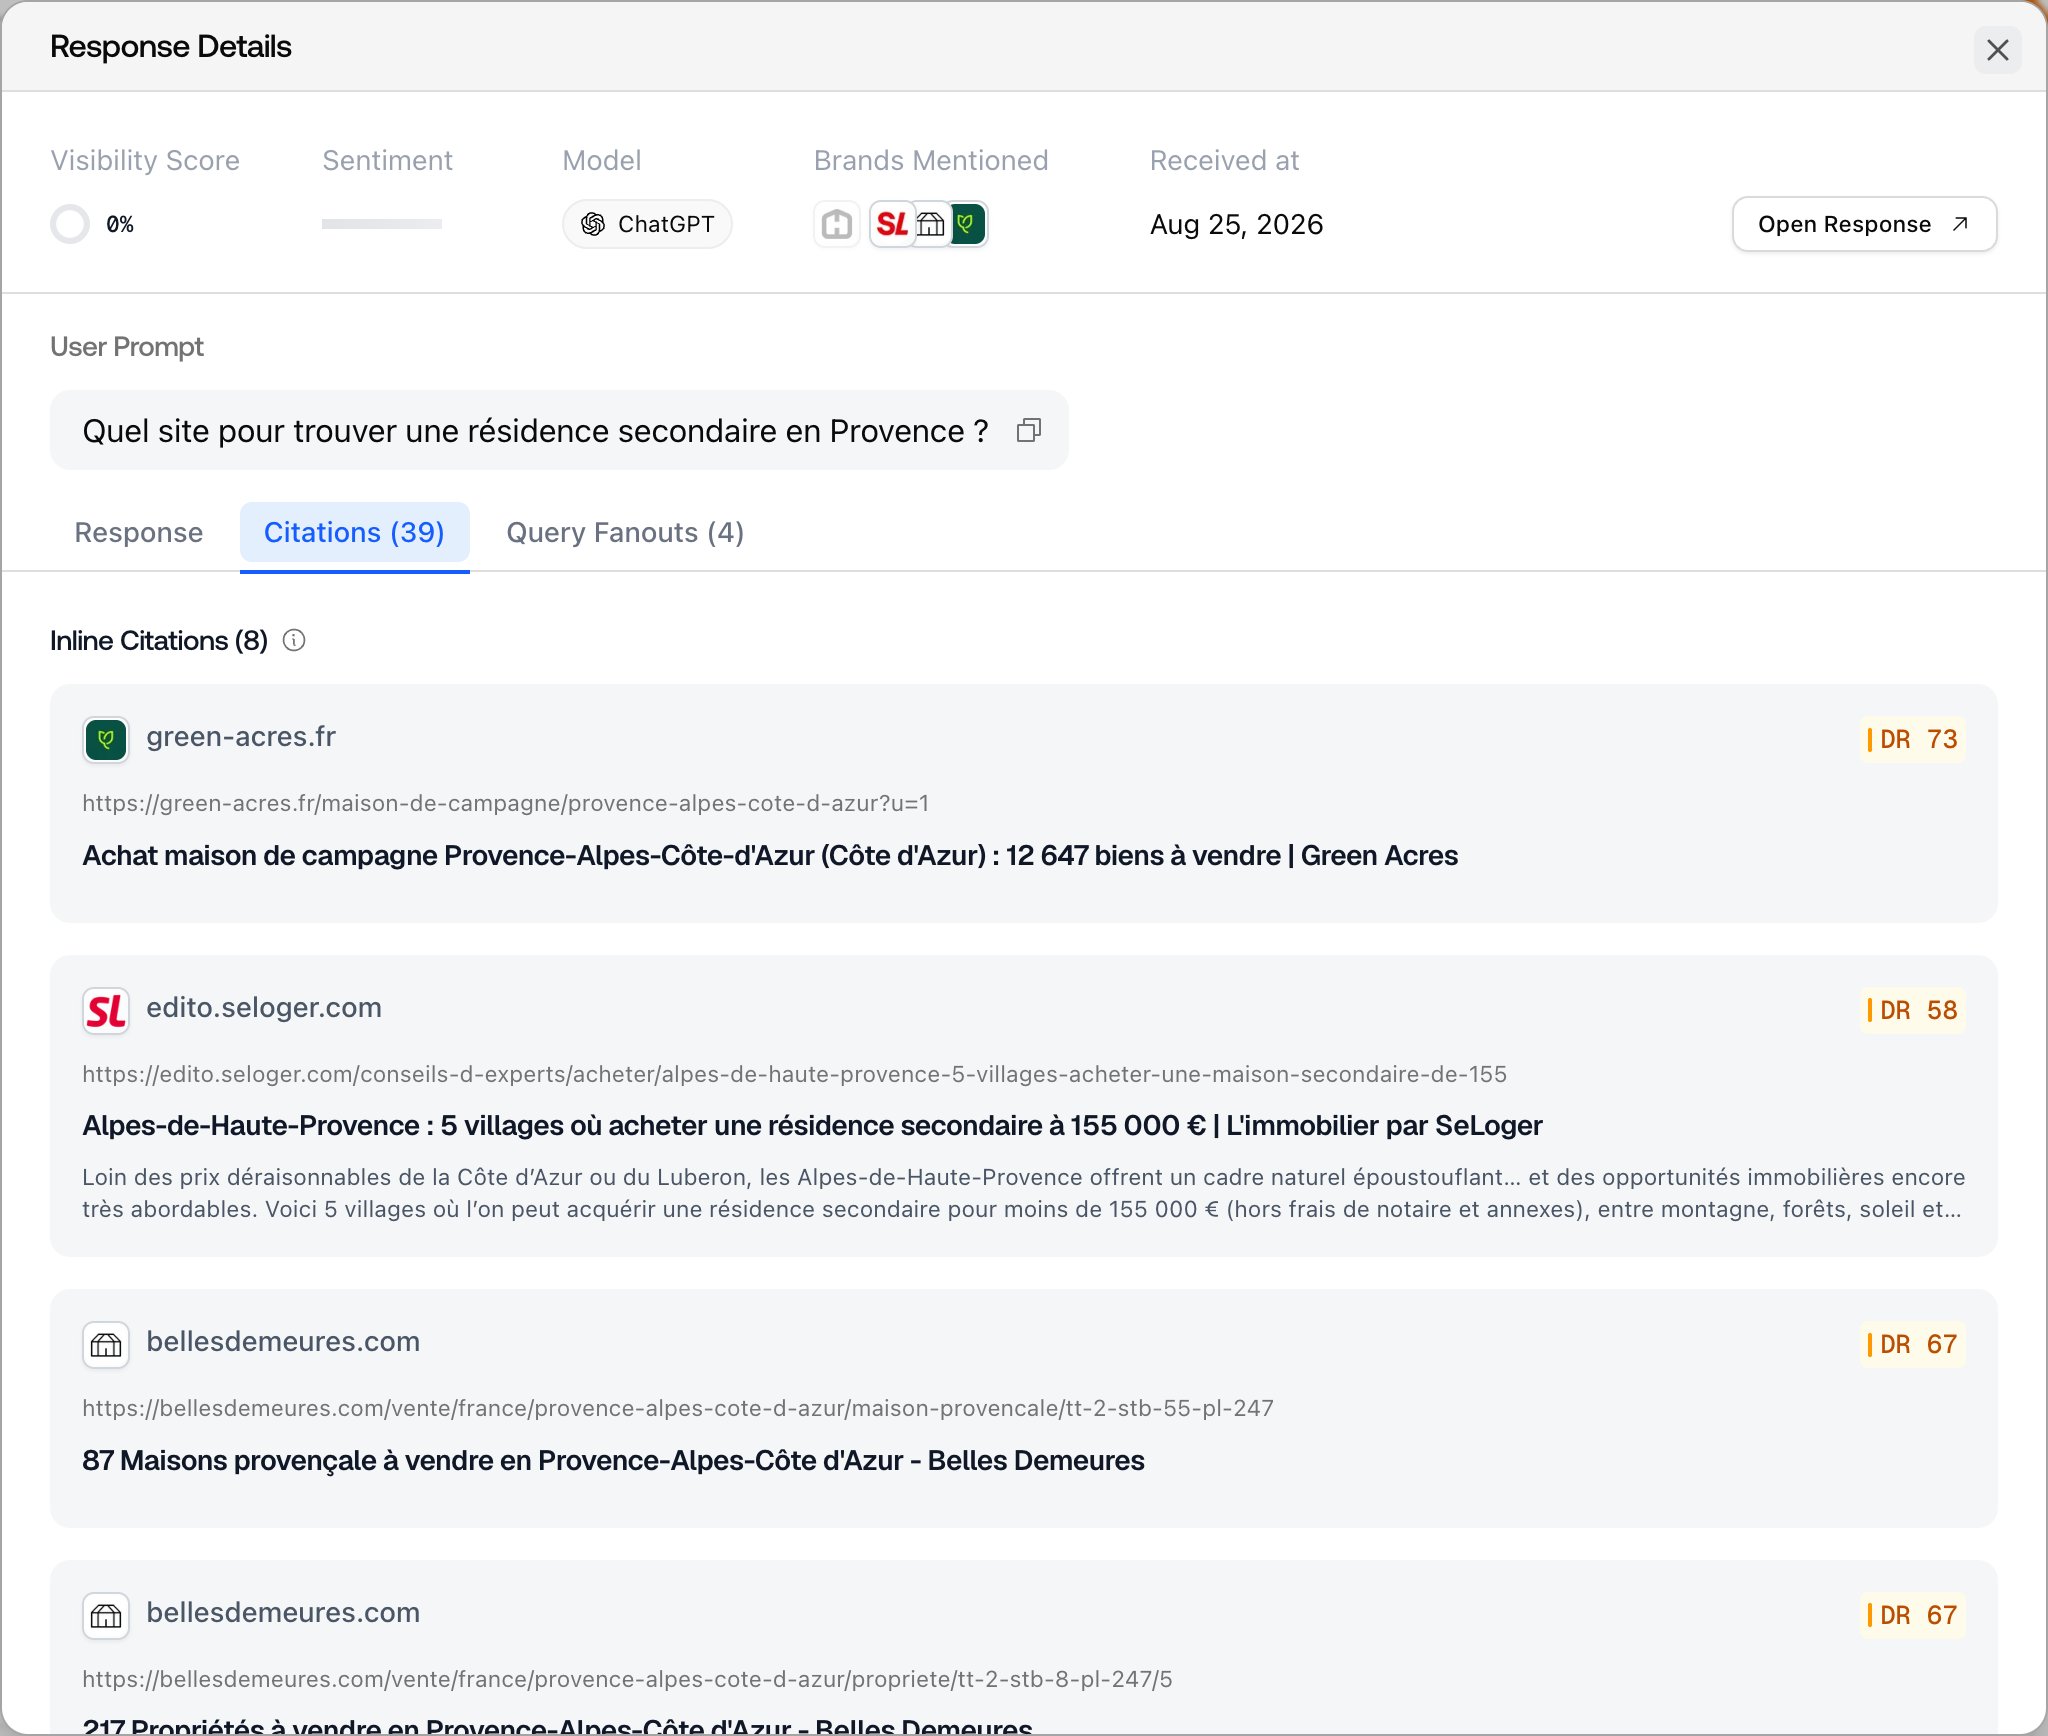
 * **Citations**: the answer's sources, grouped, each one clickable for page details. Appears when the response has citations.
 * **Ads** and **Query Fanouts**: shown when the response contained them.
### Why read raw responses at all
Metrics compress; responses explain. A visibility drop might be a model update, a competitor's new content, or your brand being named only in "I'm not familiar with..." phrasing, and those all look identical in a chart. Reading five actual responses usually settles it faster than any amount of dashboard staring. When a number moves and you want to know why, start at [the dashboard](/docs/academy/reading-your-dashboard) to find where, then come here to find out what changed.
* **Ads** and **Query Fanouts**: shown when the response contained them.
### Why read raw responses at all
Metrics compress; responses explain. A visibility drop might be a model update, a competitor's new content, or your brand being named only in "I'm not familiar with..." phrasing, and those all look identical in a chart. Reading five actual responses usually settles it faster than any amount of dashboard staring. When a number moves and you want to know why, start at [the dashboard](/docs/academy/reading-your-dashboard) to find where, then come here to find out what changed.