The Crawler Logs dashboard in Promptwatch gives you a complete view of how AI systems like ChatGPT, Claude, Perplexity, and Gemini interact with your website. It’s where technical insight meets visibility strategy, showing not only who crawled your site, but when, how often, and what happened next.
The redesigned dashboard adds powerful visualization, filters, and performance metrics so you can move from data to action faster.
What You’ll See in the Dashboard
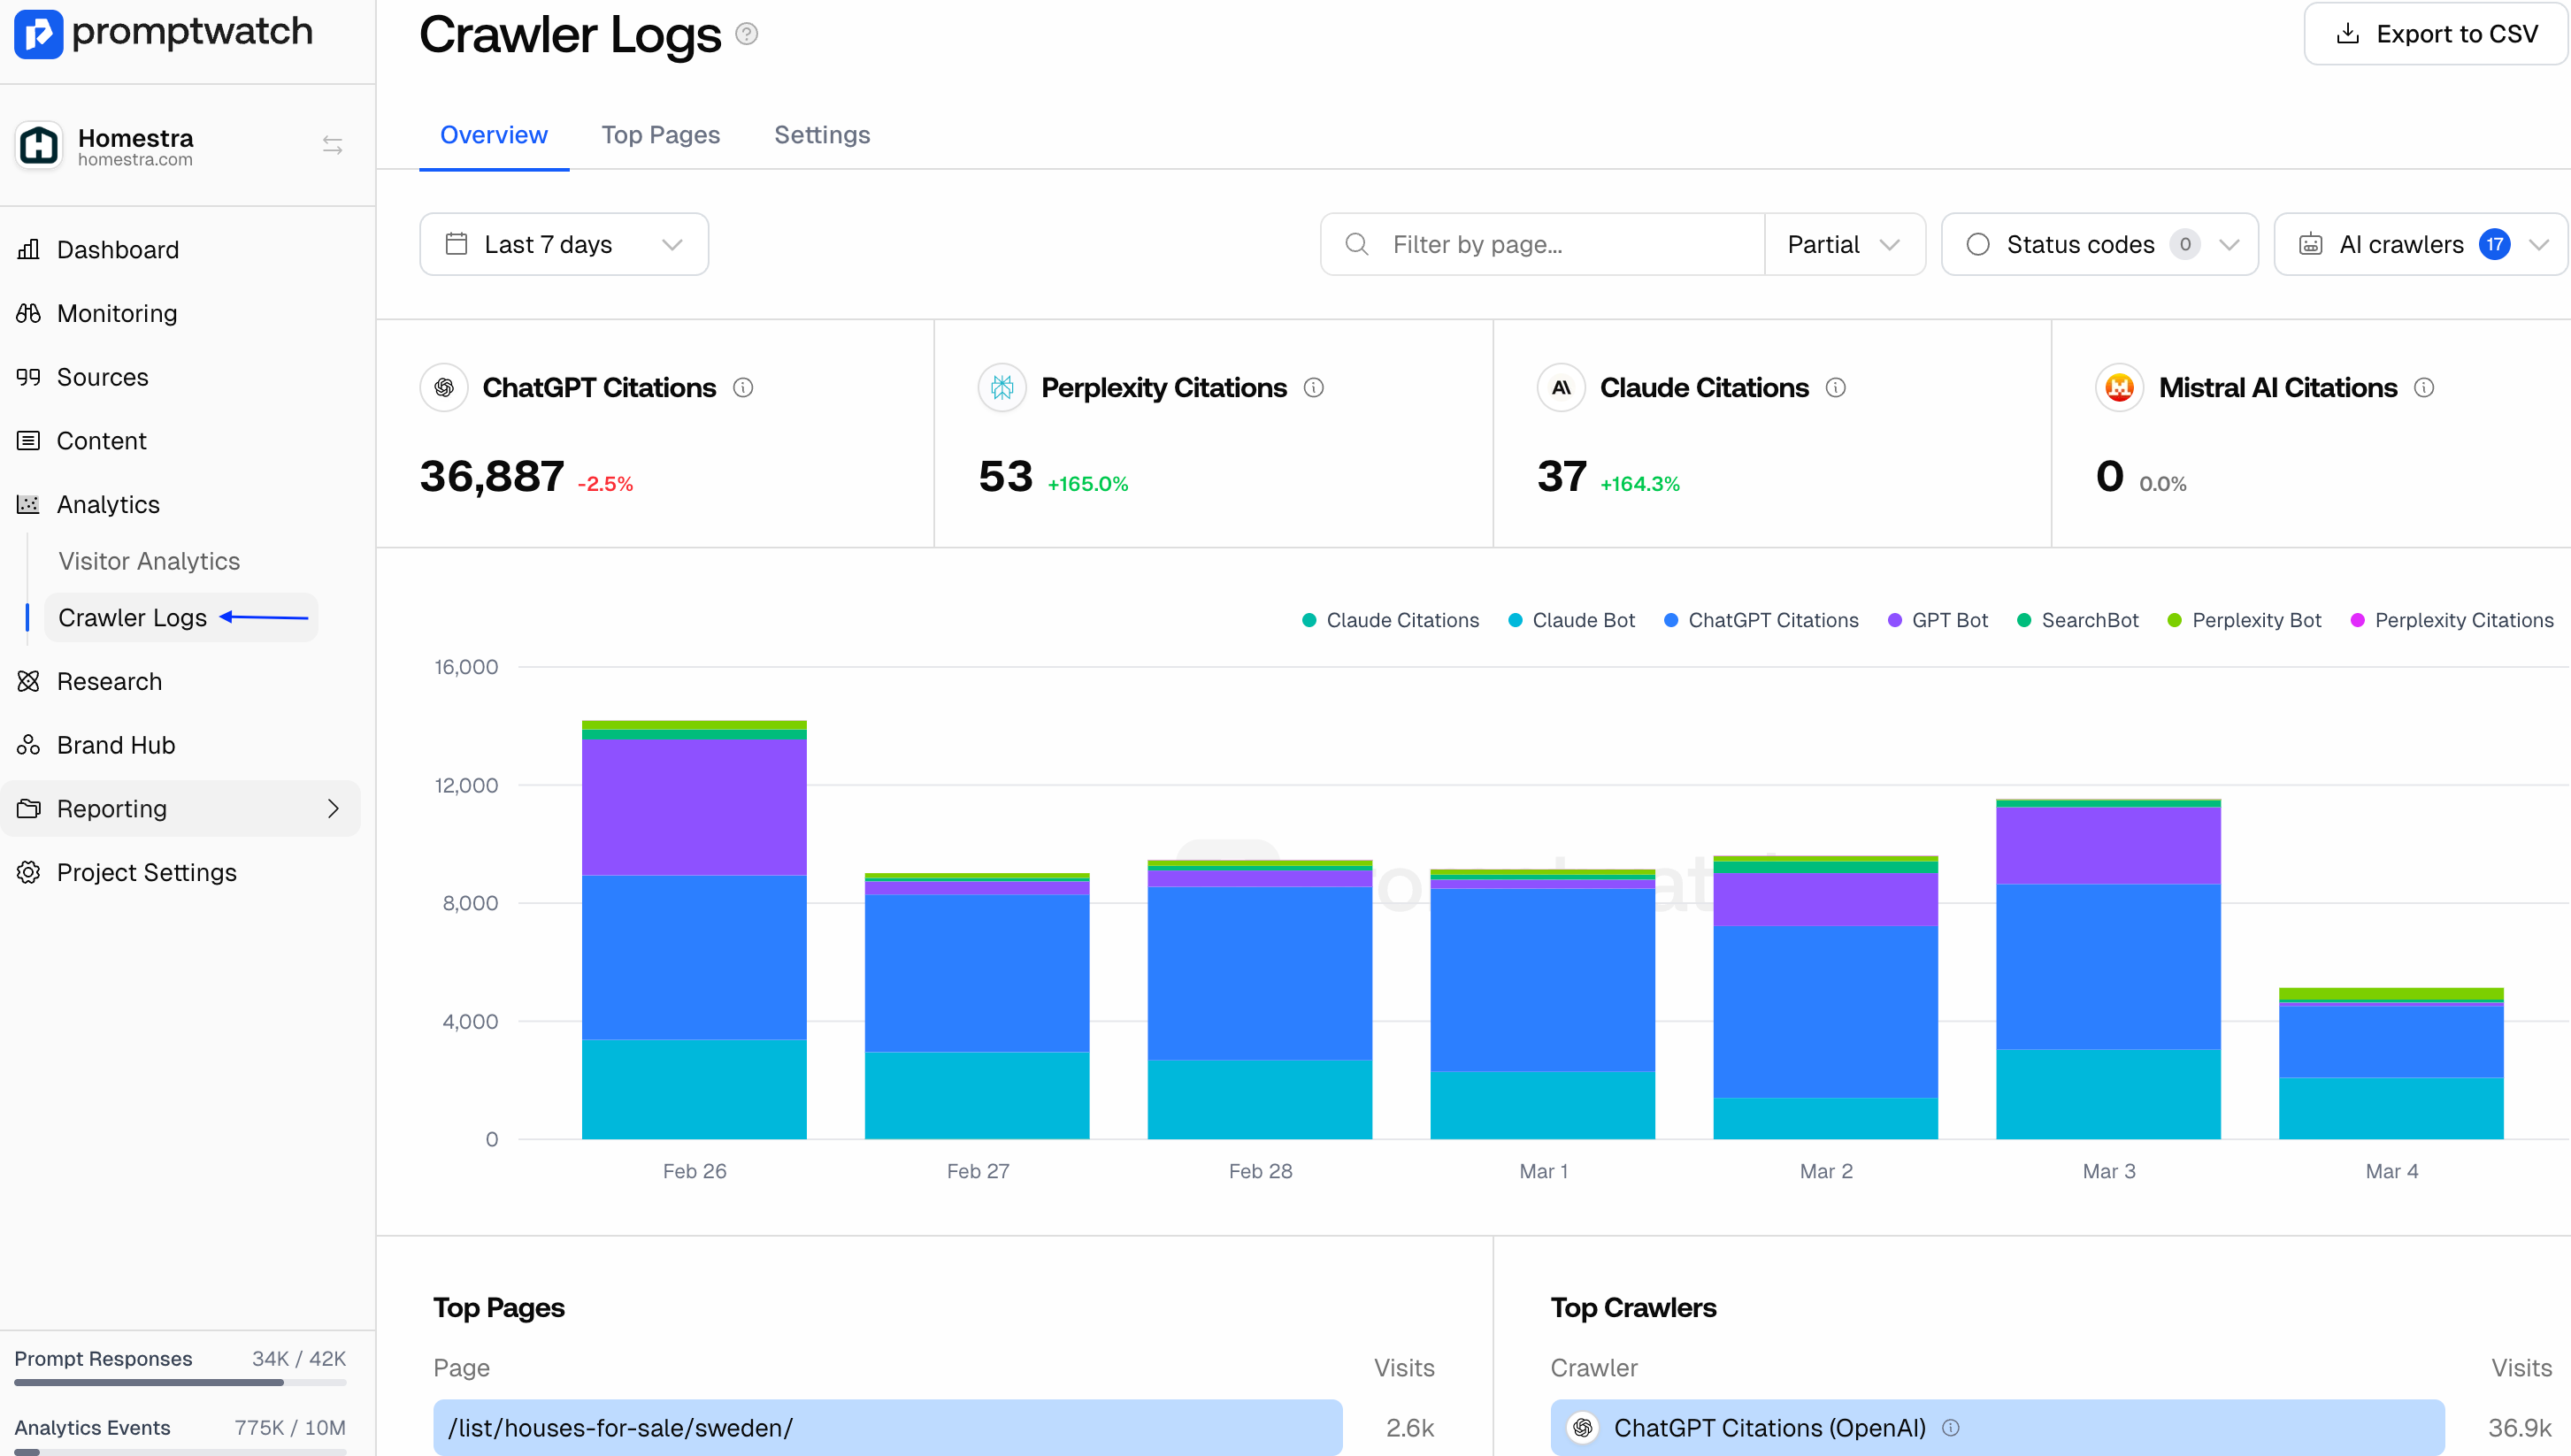
1. Selectable Time Window: Choose any date range to analyze crawl behavior over time. You can view patterns by day, week, or month, helping you spot spikes in AI activity or identify periods where crawl frequency dropped.
2. Citation Counts by Model: At the top of the dashboard, see how many citations each model (ChatGPT, Claude, Perplexity, Gemini) generated within your selected time window. This shows which AI platforms are engaging most with your content, and where you’re gaining or losing visibility.
3. Daily Crawl Breakdown: A daily bar graph visualizes total crawl volume by bot. Each color represents a different crawler, so you can instantly see which systems are most active and how their behavior shifts over time.
Performance Insights
Top Pages and Top Crawlers: Side-by-side horizontal bar graphs display:
- Top Pages: The most frequently crawled URLs on your site.
- Top Crawlers: Which AI agents are visiting most often.
Together, these graphs reveal where AI models are focusing their attention and whether that aligns with your strategic pages (like key product or content hubs).
Detailed Crawl Log Breakdown
Below the visual reports, you’ll find the raw event table, listing:
- Time: When the crawl event occurred.
- Crawler: Which bot made the request.
- Status: The HTTP response code (200, 301, 404, etc.).
- Method: GET or HEAD request used by the crawler.
- Path: The specific URL accessed.
- Query String: Any parameters used in the request.
- Referrer: The source of the crawler’s request (if available).
This granular view helps diagnose issues like broken redirects, blocked pages, or content that’s visible to one bot but missed by others.
Filtering Options
You can refine your data using two key filter sets:
- Status Codes – Filter by crawl result type, such as:
- 200 (Success): Successfully fetched pages.
- 301/302 (Redirects): Pages moved or temporarily redirected.
- 403 (Forbidden): Pages blocked by permissions.
- 404 (Not Found): Missing or deleted pages.
- 500 (Server Error): Failed page loads that prevent crawling.
- AI Crawler Type – Focus on specific agents like GPTBot, ClaudeBot, or PerplexityBot to analyze visibility across different AI models.
These filters make it easy to isolate crawl problems or study how different AI platforms behave.
How to Use These Insights
- Optimize Your Most-Crawled Pages: High crawl frequency signals authority, ensure those pages are up to date and technically healthy.
- Fix Crawl Errors Immediately: 403s, 404s, and 500s mean lost visibility. Prioritize these URLs.
- Balance Model Exposure: If GPTBot dominates crawls but ClaudeBot doesn’t appear, adjust content tone and structure for better AI diversity.
- Track Crawl Trends: Spikes in activity often follow sitemap updates or content refreshes, use them as feedback for what’s working.
Next Steps
Visit your Crawler Logs Dashboard weekly to monitor trends and spot issues before they impact your AI visibility. Each crawl event tells you how discoverable your content really is, and whether AI systems can access the pages that define your brand.
Tip: Combine crawler insights with your Citations Dashboard. Pages that are heavily crawled but rarely cited are perfect candidates for content updates or authority-building efforts.