Two numbers, and the confusion between them
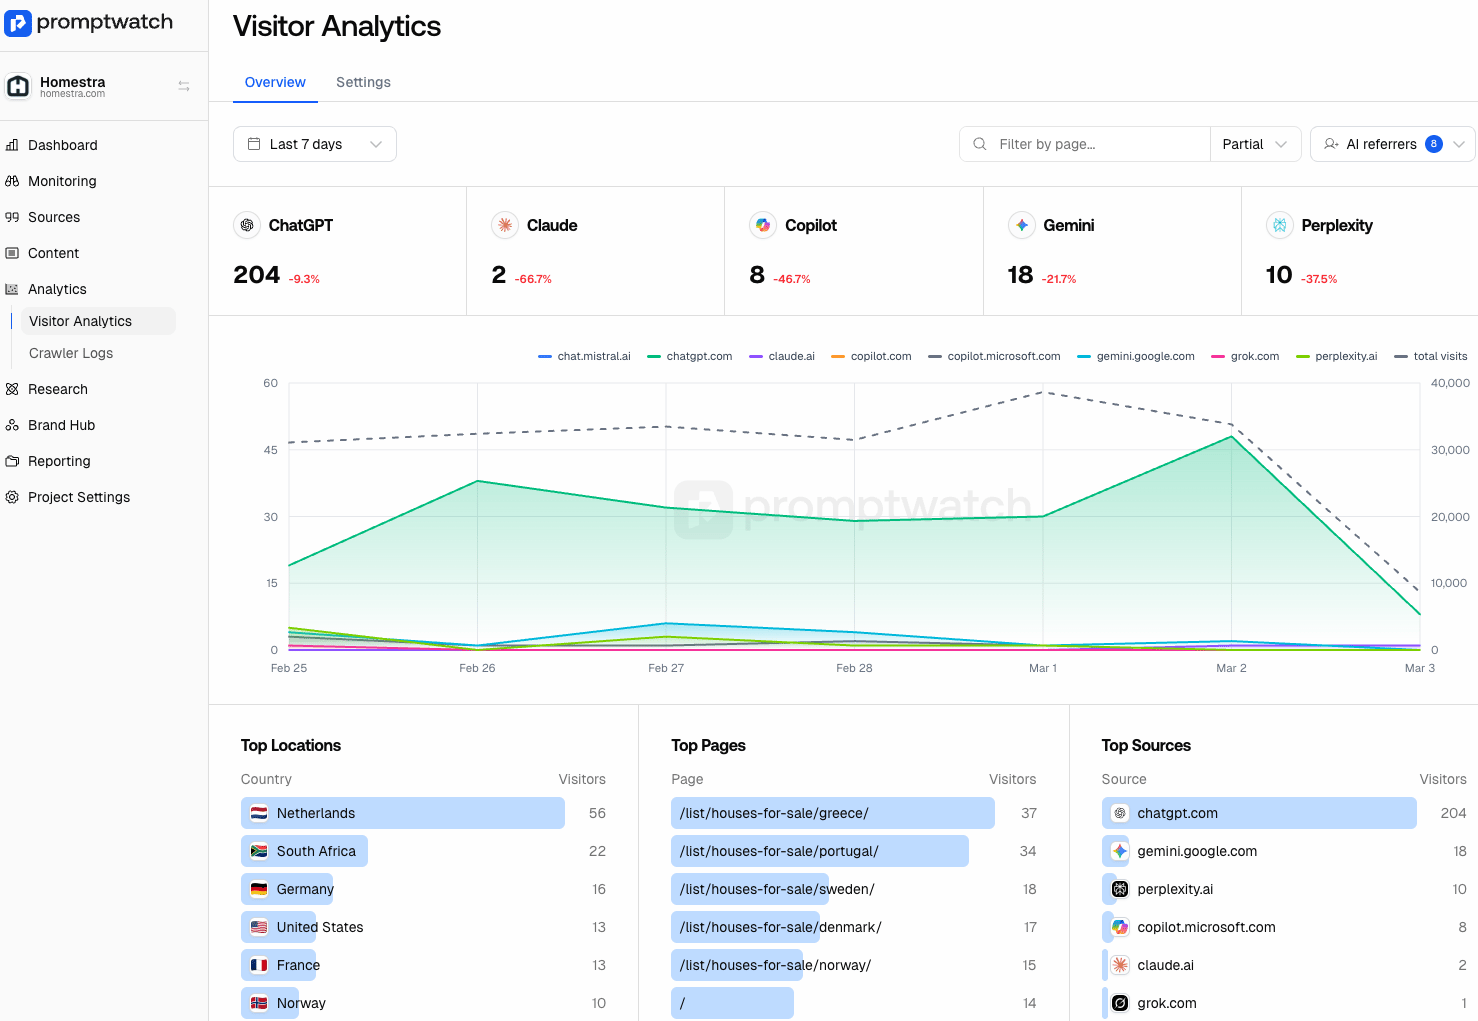
The page shows two distinct metrics, and mixing them up is the most common misreading:- Total visits: every visit to your website from any source, organic, direct, social, paid, email, and AI combined. It’s the same full-traffic number you’d see in Google Analytics, drawn as a gray line in the trend chart so you can gauge AI traffic as a share of your whole audience.
- AI referrer visits: the subset where the visitor arrived from an AI platform, counted per platform by referrer domain. Someone clicks through to your site from a ChatGPT answer and the visit is recorded under ChatGPT.
Which platforms are tracked
Visits are attributed by referrer domain: chatgpt.com, gemini.google.com, perplexity.ai, copilot.microsoft.com, copilot.com, m365.cloud.microsoft, copilot.cloud.microsoft, claude.ai, claude.com, grok.com, chat.mistral.ai, mistral.ai, chat.deepseek.com, deepseek.com, and kimi.com (in the per-platform cards, copilot.com, m365.cloud.microsoft, and copilot.cloud.microsoft traffic is merged into the Copilot number, and claude.com into Claude). Everything else counts toward total visits but not toward any AI platform.Set up the tracking script
The first time you open the page you’ll see the setup flow behind a Setup visitor analytics button; the same flow lives permanently under the Settings tab. The data is privacy-safe and GDPR compliant: stored in the EU, no user-identifiable information, no consent banner required.Option A: install manually
Copy the snippet shown in the Manual tab and paste it into the head of your website. The script carries your project ID, so make sure you install the snippet from the right project.Option B: install via Google Tag Manager
The Google Tag Manager tab walks you through it: add the Promptwatch template from the GTM community gallery (Templates → Search Gallery, search for Promptwatch, then Add to workspace), create a new tag from that template, paste in your Project ID, set the trigger to All Pages, then Save, Submit, and Publish the container.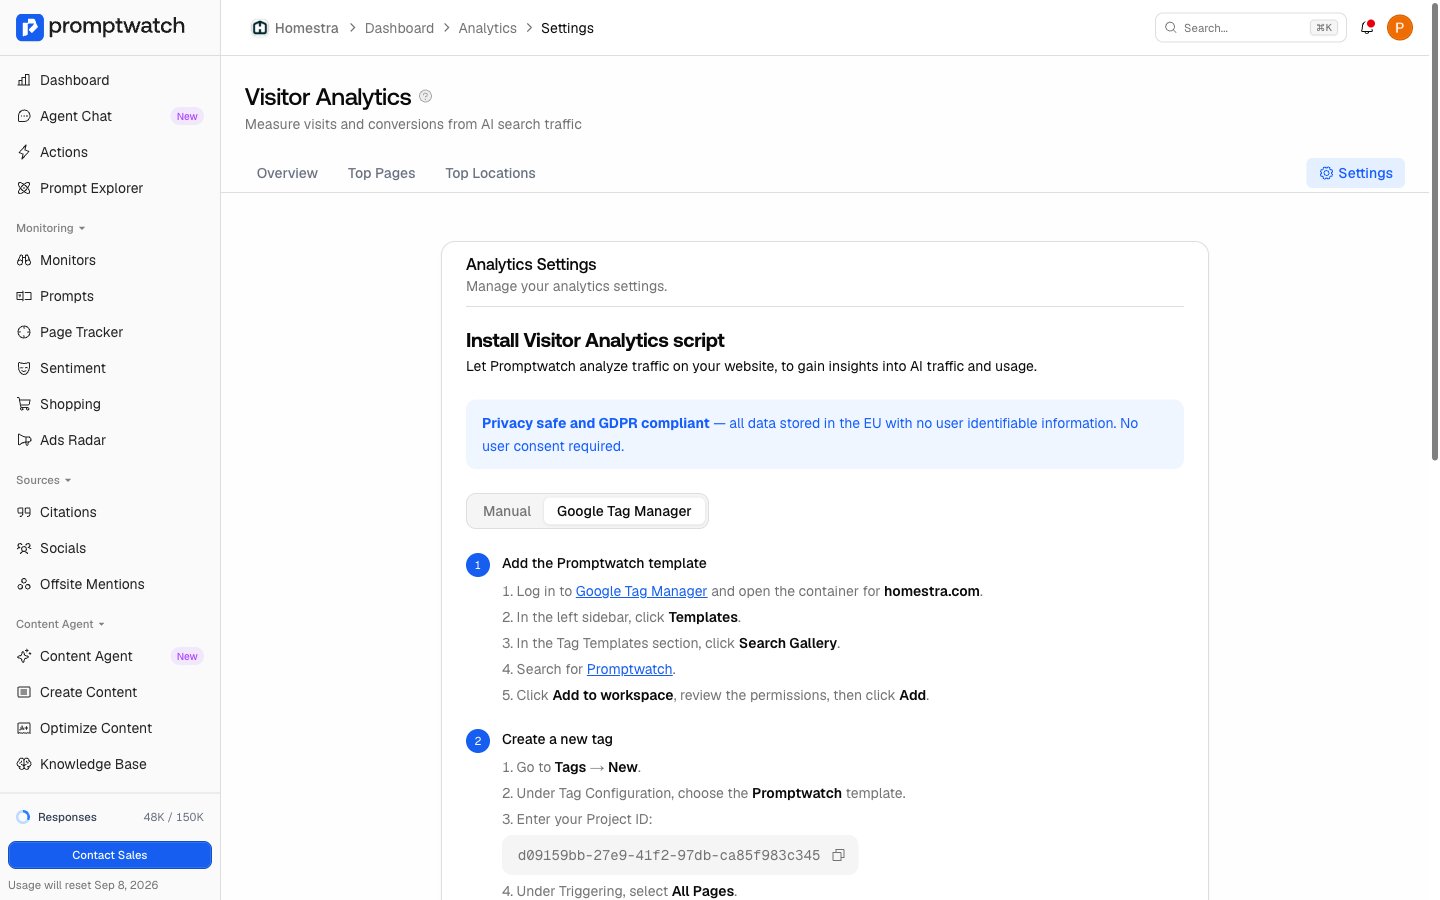
Verify
Click Start receiving data. Once verified, your first data appears within a few minutes.What the page shows
- Per-platform cards: visits from ChatGPT, Claude, Gemini, Perplexity, and Copilot in the selected range, each with a percentage change against the previous period of the same length, so a platform ramping up or going quiet is the first thing you see.
- Trend chart: one series per AI platform plus the gray total-visits line. Pick the 24-hour preset and the chart switches to minute-level granularity, useful right after publishing content that’s expected to get cited.
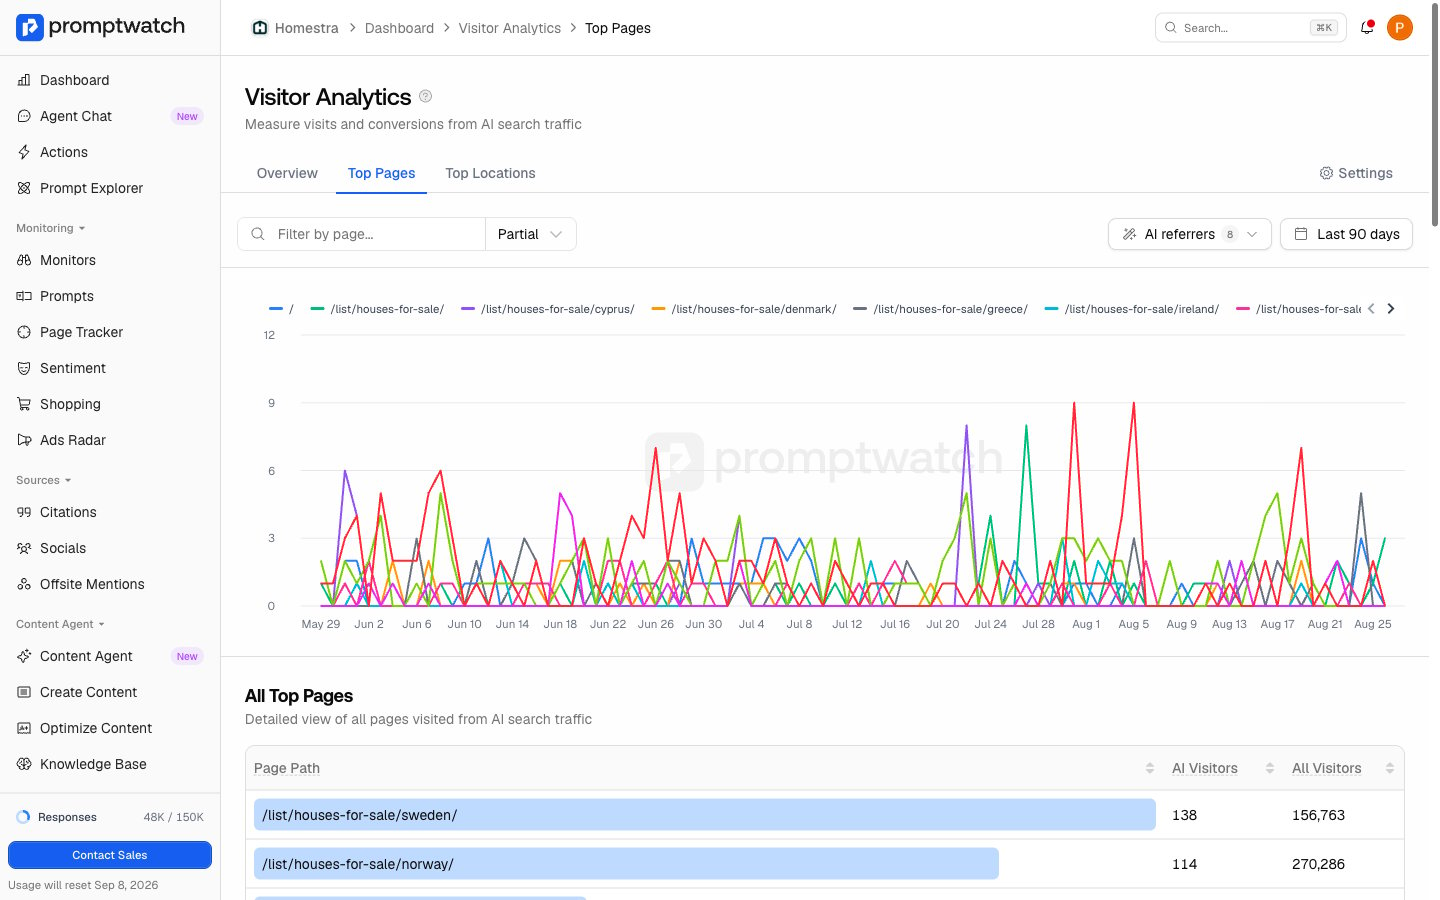
- Top lists: five top-10 breakdowns side by side. Top Locations (countries), Top Pages (the paths AI visitors land on), Top Sources (visits per AI platform), Top Devices, and Top Browsers. Clicking a country filters the page by it; clicking a source filters the trend chart and top lists.
Filters and drill-downs
The trend chart and top lists follow three filters: the AI referrers multi-select, a path filter (partial match by default, exact match optional), and the date range. The per-platform cards always show the five platforms for the selected date range. When the top-10 lists aren’t enough, the Top Pages and Top Locations tabs open full sortable tables, 50 rows per page, each with its own trend chart, so you can trace how a single landing page or country developed over time.