

New Feature
GEO 360: Topic Insights
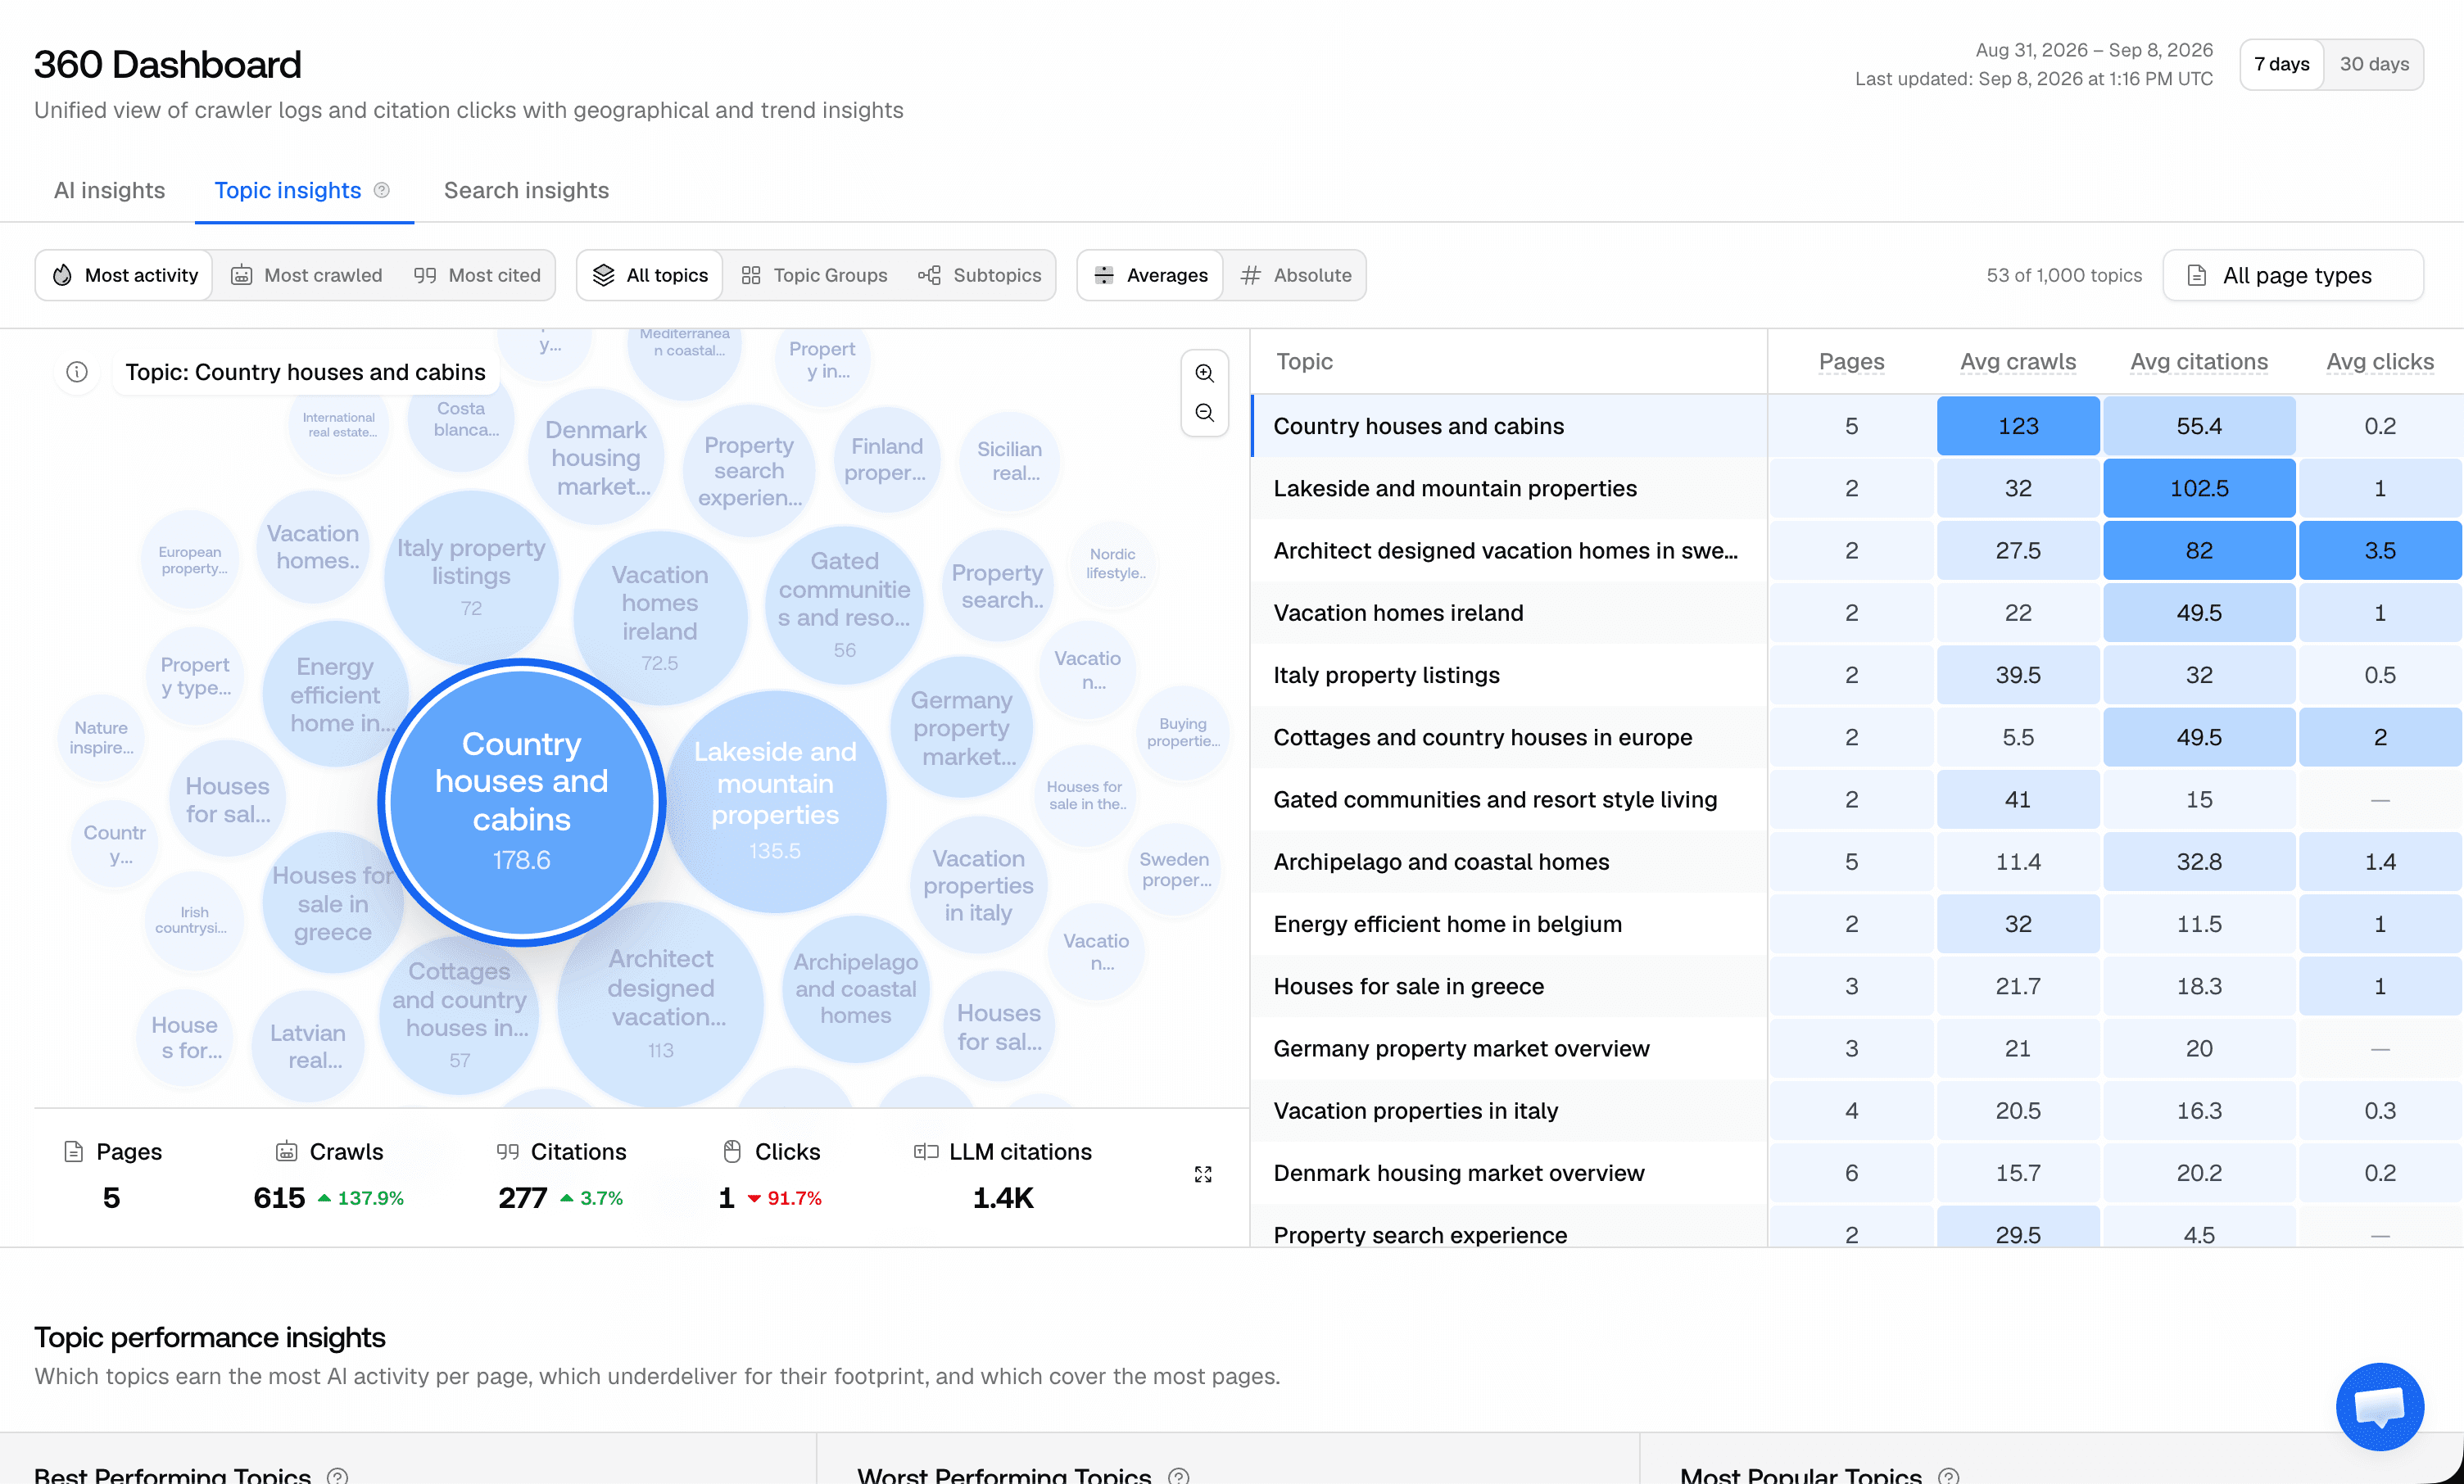
The 360 Dashboard has a new Topic insights tab. Every page on your site is grouped into topics, and each topic shows how many pages it covers and the average AI crawls, citations, and clicks those pages get. A bubble chart lays out the whole landscape, so you can see at a glance which topics AI engines pick up and which ones sit idle.
- Sort the landscape by most activity, most crawled, or most cited, and switch between averages and absolute numbers.
- Zoom from all topics into topic groups and subtopics, and click a bubble to open the pages, crawls, citations, and LLM citations behind it.
- Best, worst, and most popular topics are called out below the chart: which topics earn the most AI activity per page, which underdeliver for their footprint, and which cover the most pages.
- The first hundred topics load right away and the rest page in as you scroll.

