


TL;DR
- An AI visibility score is a 0 to 100 number for how prominently a brand appears across a set of AI answers, combining whether it appears, where it sits, and how much of the answer it gets.
- The rule that moves scores the most is how a tool treats answers that leave your brand out: counted as zero, they pull the average down to match your real presence.
- Scores from different tools can't be compared, because prompt sets, engines, run counts and absence handling all differ, so compare one tool against itself over time.
- A good score is one that beats your closest competitors on your own prompt set and keeps rising over several weeks.
- Promptwatch scores every response against nine published placement bands, counts absences as zero, and keeps sentiment in a separate score.
What is an AI visibility score?
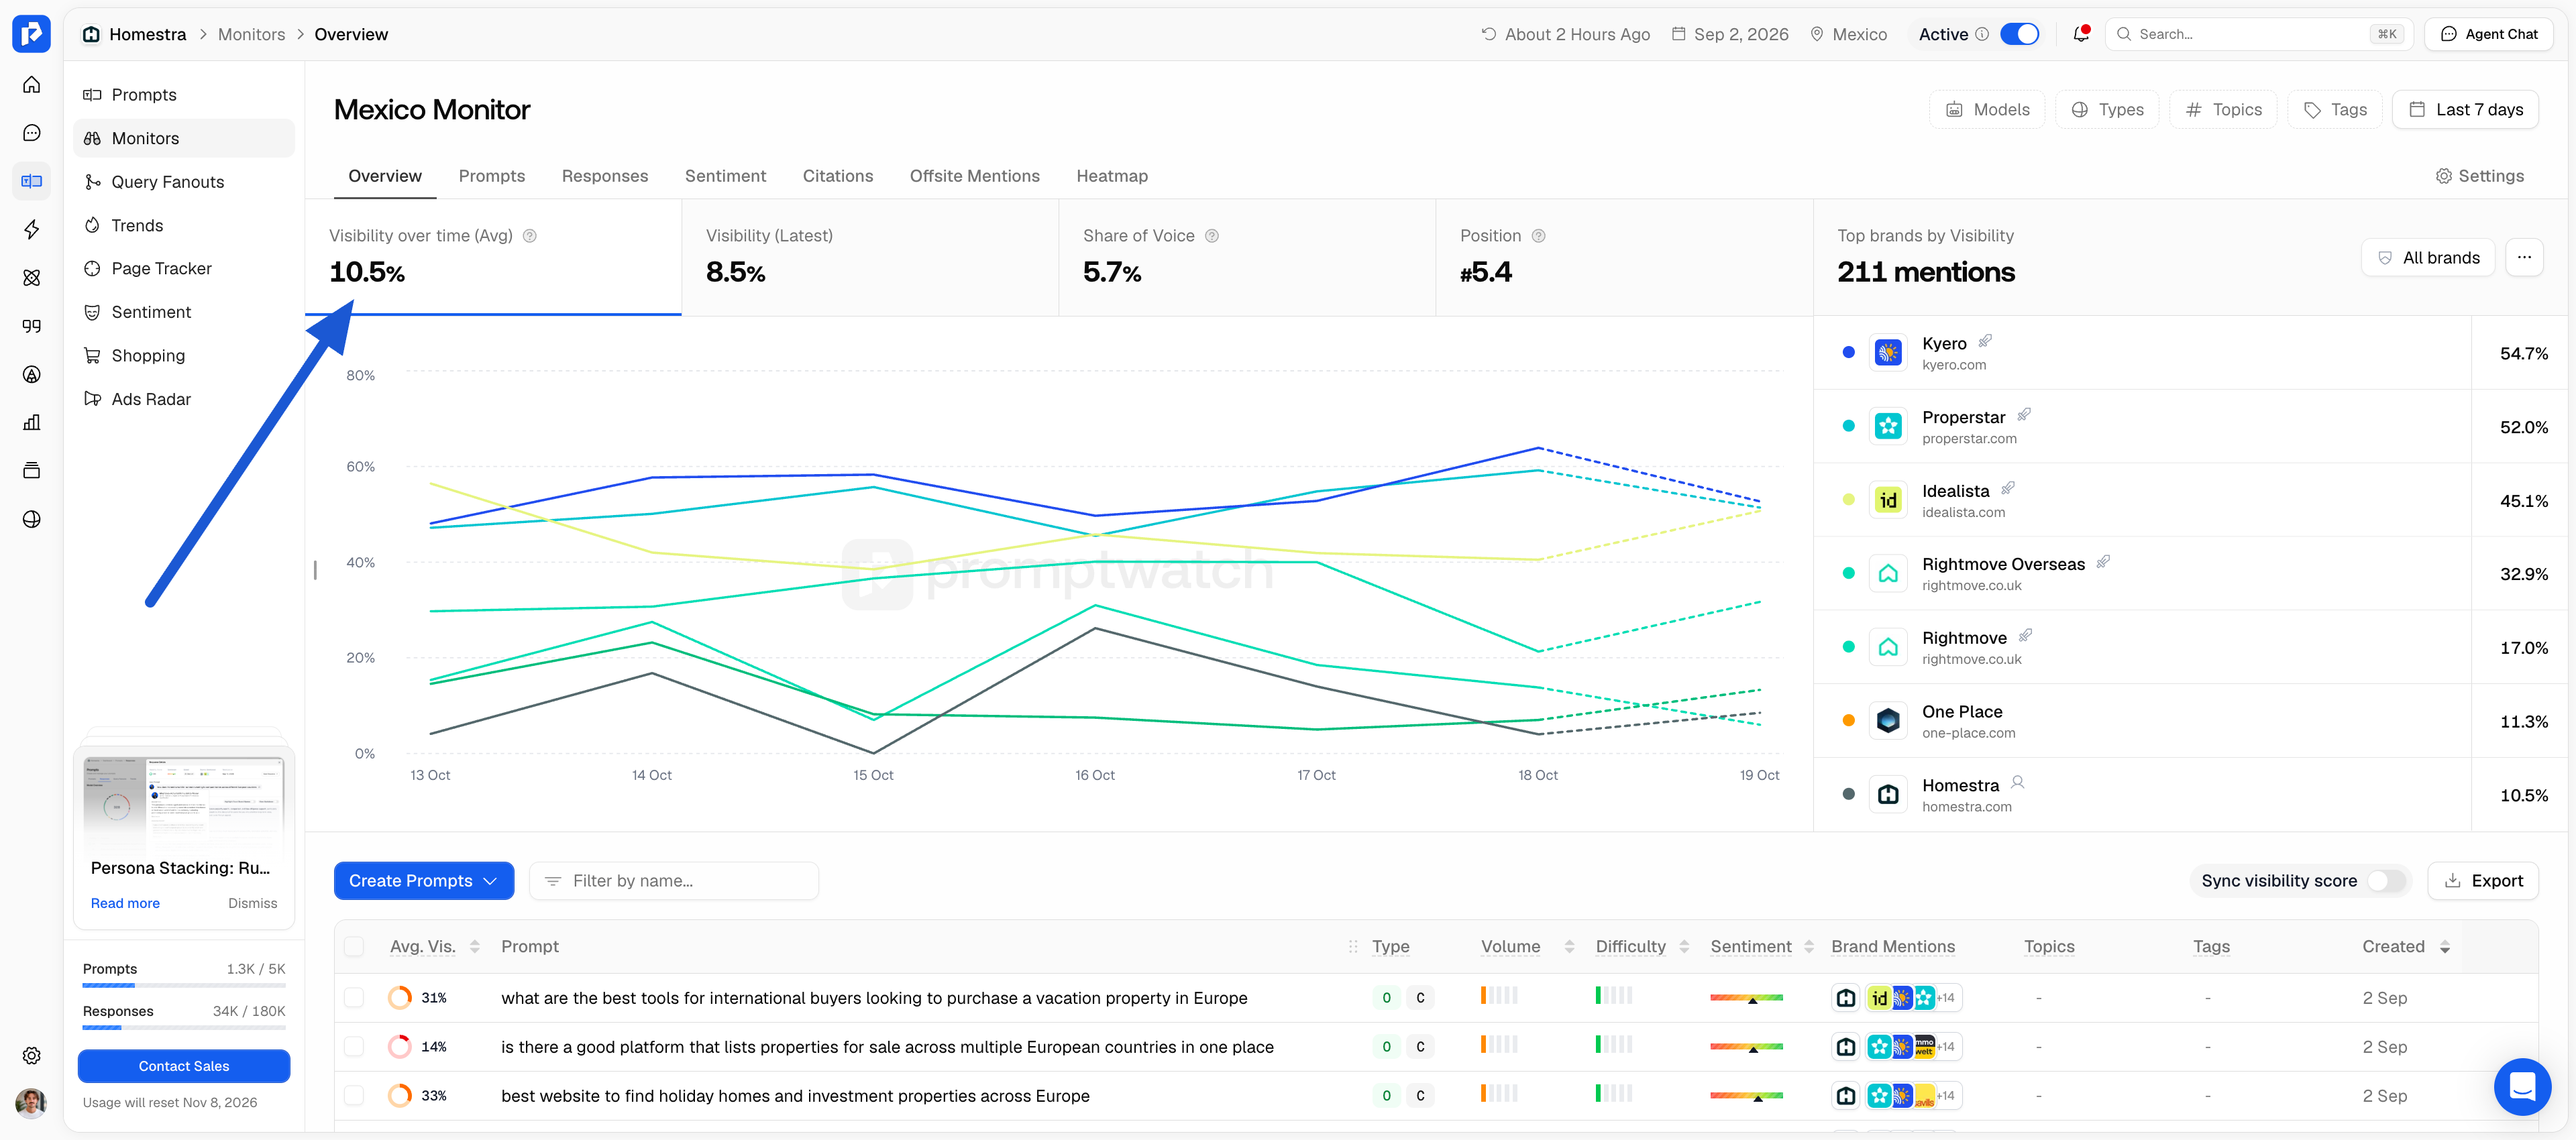
An AI visibility score is a 0 to 100 metric for how prominently a brand appears in AI-generated answers from engines like ChatGPT, Gemini, Perplexity, Claude and Google AI Overviews. Each answer gets its own score, and the headline number is the average across every answer in the set.
The metric exists because AI search has no rank position to read off. In classic SEO, a page sits at position 3 and that number is the report. In AI search, the unit is the response: the brand is the lead recommendation, the fourth name in a list, a one-line aside, or absent. A visibility score turns thousands of those outcomes into one number you can track week to week.
What goes into an AI visibility score?
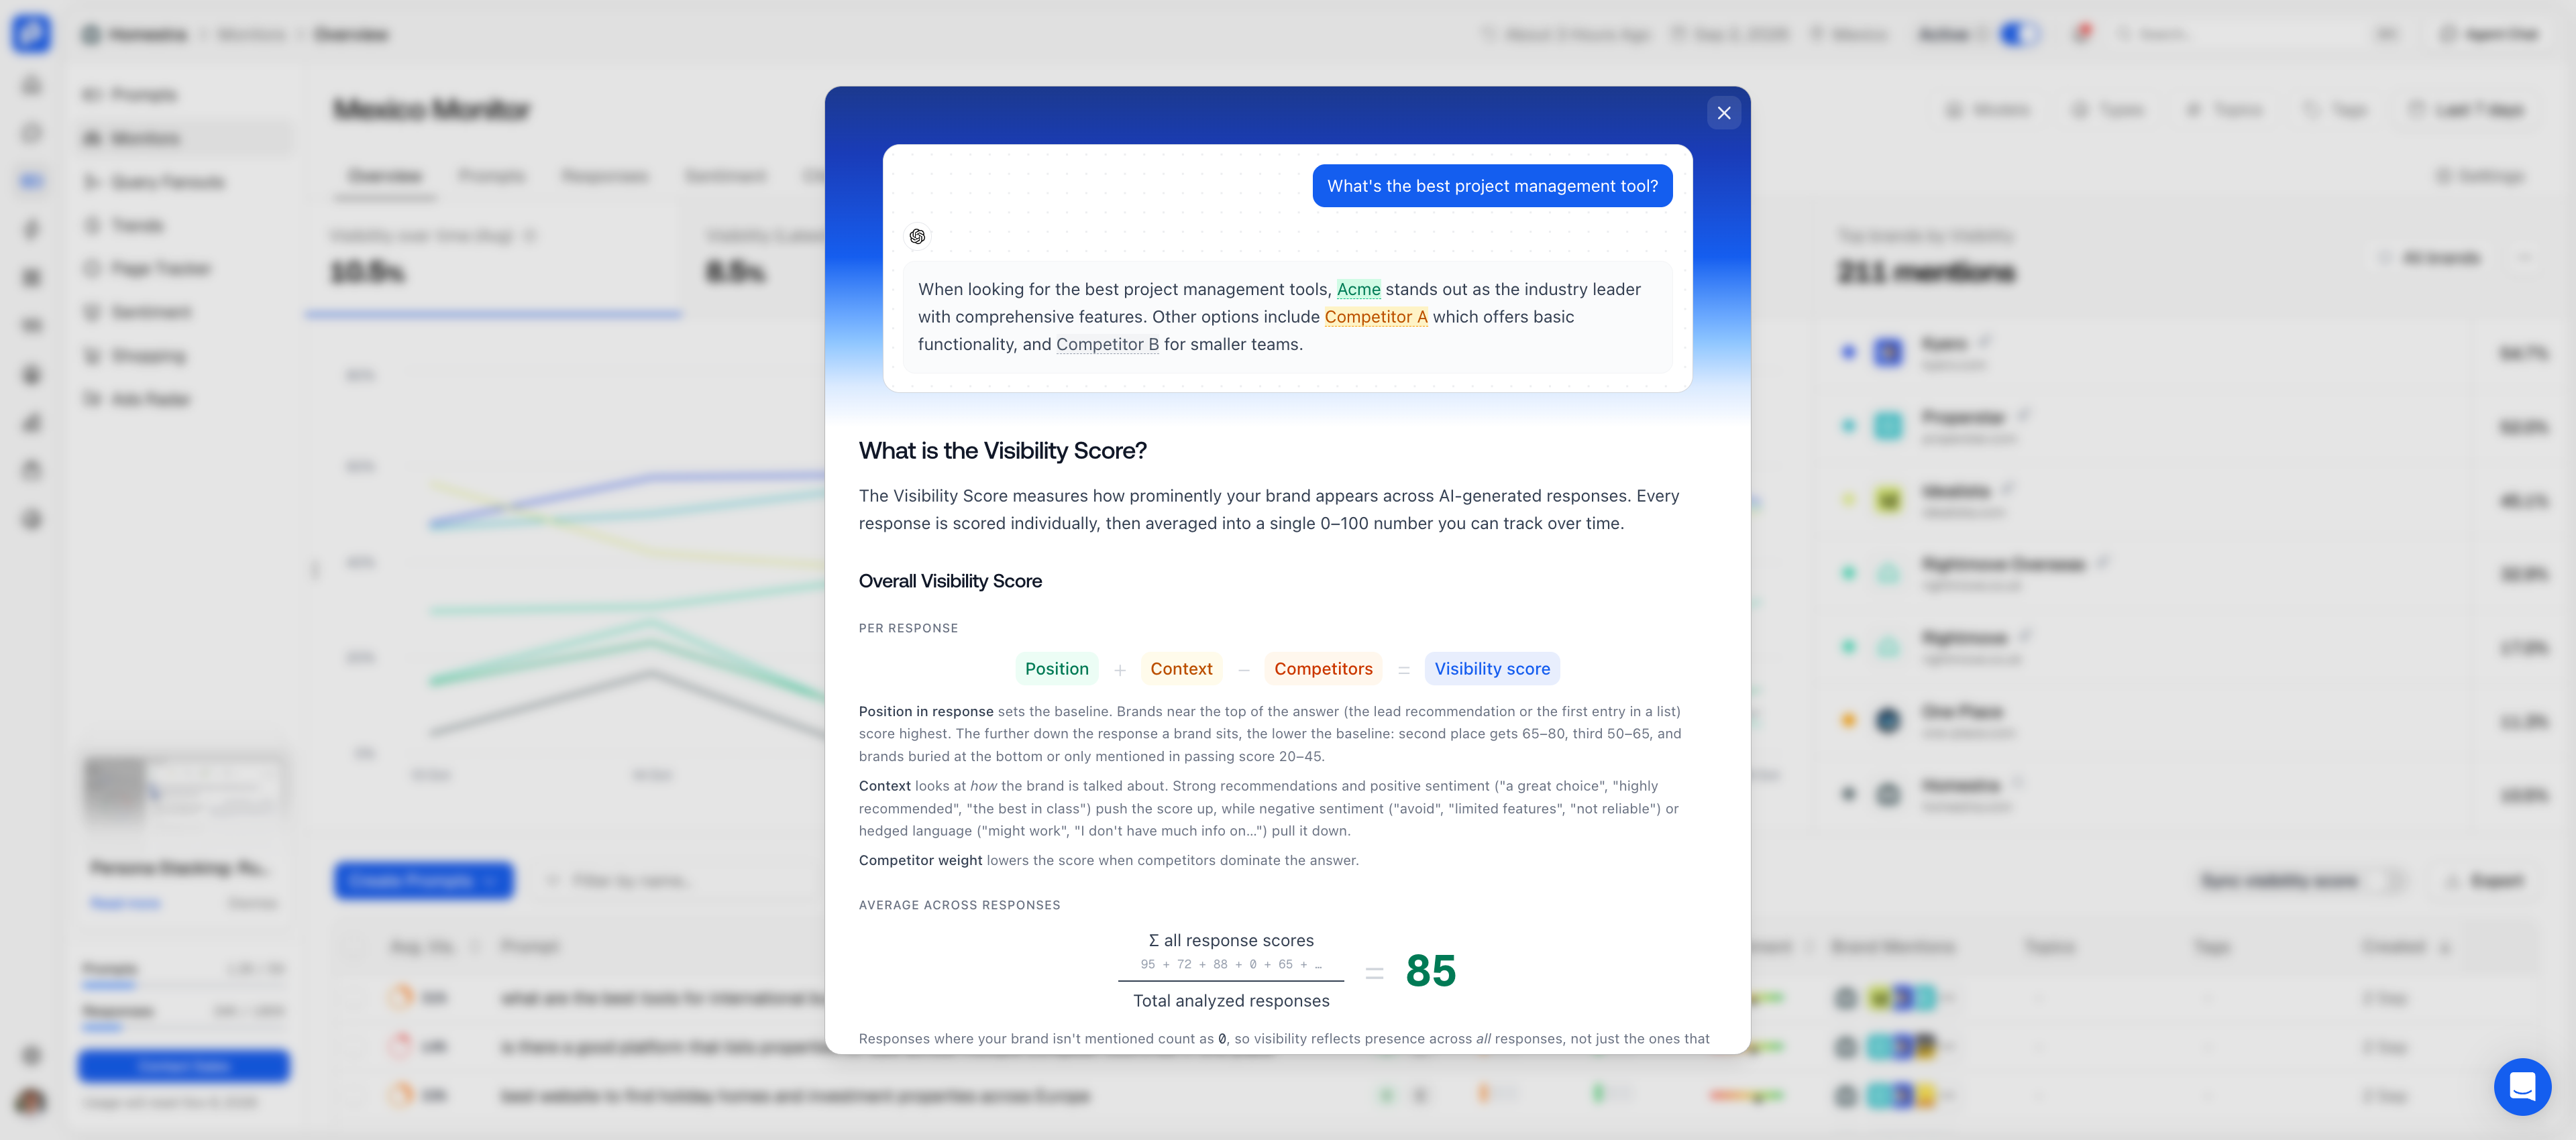
Every credible AI visibility score uses the same four inputs:
- Presence: does the brand appear in the response at all?
- Placement: where does it appear, as the sole pick, first in a list, or a passing mention?
- Attention: how much of the answer is about the brand, through headings, repeated mentions and comparison detail?
- Competition: how many other brands share the answer, and how much of it do they take?
Tools score each response on these inputs and then average the results. The differences between vendors come from how they weight each input, and above all from one decision about the answers your brand isn't in.
Why answers without your brand decide the score
The biggest driver of difference between two scores for the same brand is whether the tool counts responses that never mention the brand. Here is one set of ten responses scored both ways:
| Method A: average of mentions only | Method B: absences counted as 0 | |
|---|---|---|
| Responses analyzed | 10 | 10 |
| Responses that mention the brand | 5 | 5 |
| Scores on those five | 100, 92, 72, 57, 15 | 100, 92, 72, 57, 15 |
| The other five responses | Excluded | Counted as 0 |
| Reported score | 67.2 | 33.6 |
Same brand, same week, same answers. Method A tells you how well you do when you show up. Method B tells you how visible you are across the questions your buyers actually ask, which is the number that matches reality. Promptwatch uses Method B, and the answers you're missing from are usually where the work starts (see why brands lose visibility in AI search engines).
How Promptwatch calculates its Visibility Score
Promptwatch scores every AI response from 1 to 100 based on prominence, gives 0 to any response that doesn't substantively mention the brand, and averages all responses with the zeros included. The method is published in full so the number can be checked against the raw answers behind it.
Placement sets the baseline
Where the brand sits in the answer sets its starting score:
| Placement in the answer | Baseline score |
|---|---|
| Sole recommendation | 100 |
| Dominant pick among several | 95 to 99 |
| First in a ranked list | 90 to 94 |
| Major secondary focus | 81 to 89 |
| Second place | 65 to 80 |
| Third place | 50 to 64 |
| Fourth or later | 25 to 49 |
| Brief passing mention | 10 to 24 |
| Minimal mention | 1 to 9 |
| Not mentioned | 0 |
Attention and depth adjust it
Placement is a starting point, and the share of attention moves the score within and around that band. A dedicated heading, repeated mentions or substantial comparison detail raise it. Being merely listed, hedged ("might be an option") or overshadowed by another brand lowers it.
That is why a brand named first can still score modestly. If the answer lists you first and then spends three paragraphs on a competitor, the competitor owns the answer and the score reflects that.
Some mentions score zero
Three kinds of response count as not mentioned and score 0:
- The brand doesn't appear at all.
- The model says something like "I don't have information about Acme." The name is in the text, but the model has told the user nothing about the brand.
- The brand's name appears only in a cited URL or source title, with no mention in the answer itself.
A string-matching tool would count the second and third cases as mentions. This is how a brand can be "mentioned" in a large share of responses and still carry a low visibility score.
Every response is averaged, zeros included
The headline number is the sum of all response scores divided by the total number of responses analyzed. Using the ten responses from the table above:
| Response | What happened | Score |
|---|---|---|
| 1 | Sole recommendation | 100 |
| 2 | First in a ranked list | 92 |
| 3 | Second place | 72 |
| 4 | Third place | 57 |
| 5 | Brief passing mention | 15 |
| 6 | "I don't have information about this brand" | 0 |
| 7 | Brand appears only in a cited source title | 0 |
| 8 to 10 | Brand not mentioned | 0 each |
| Visibility Score (336 ÷ 10) | 33.6 |
In the dashboard, "Visibility over time (Avg)" averages the daily scores across the selected date range, and "Visibility (Latest)" shows only the most recent day.
Why sentiment and citations sit outside the score
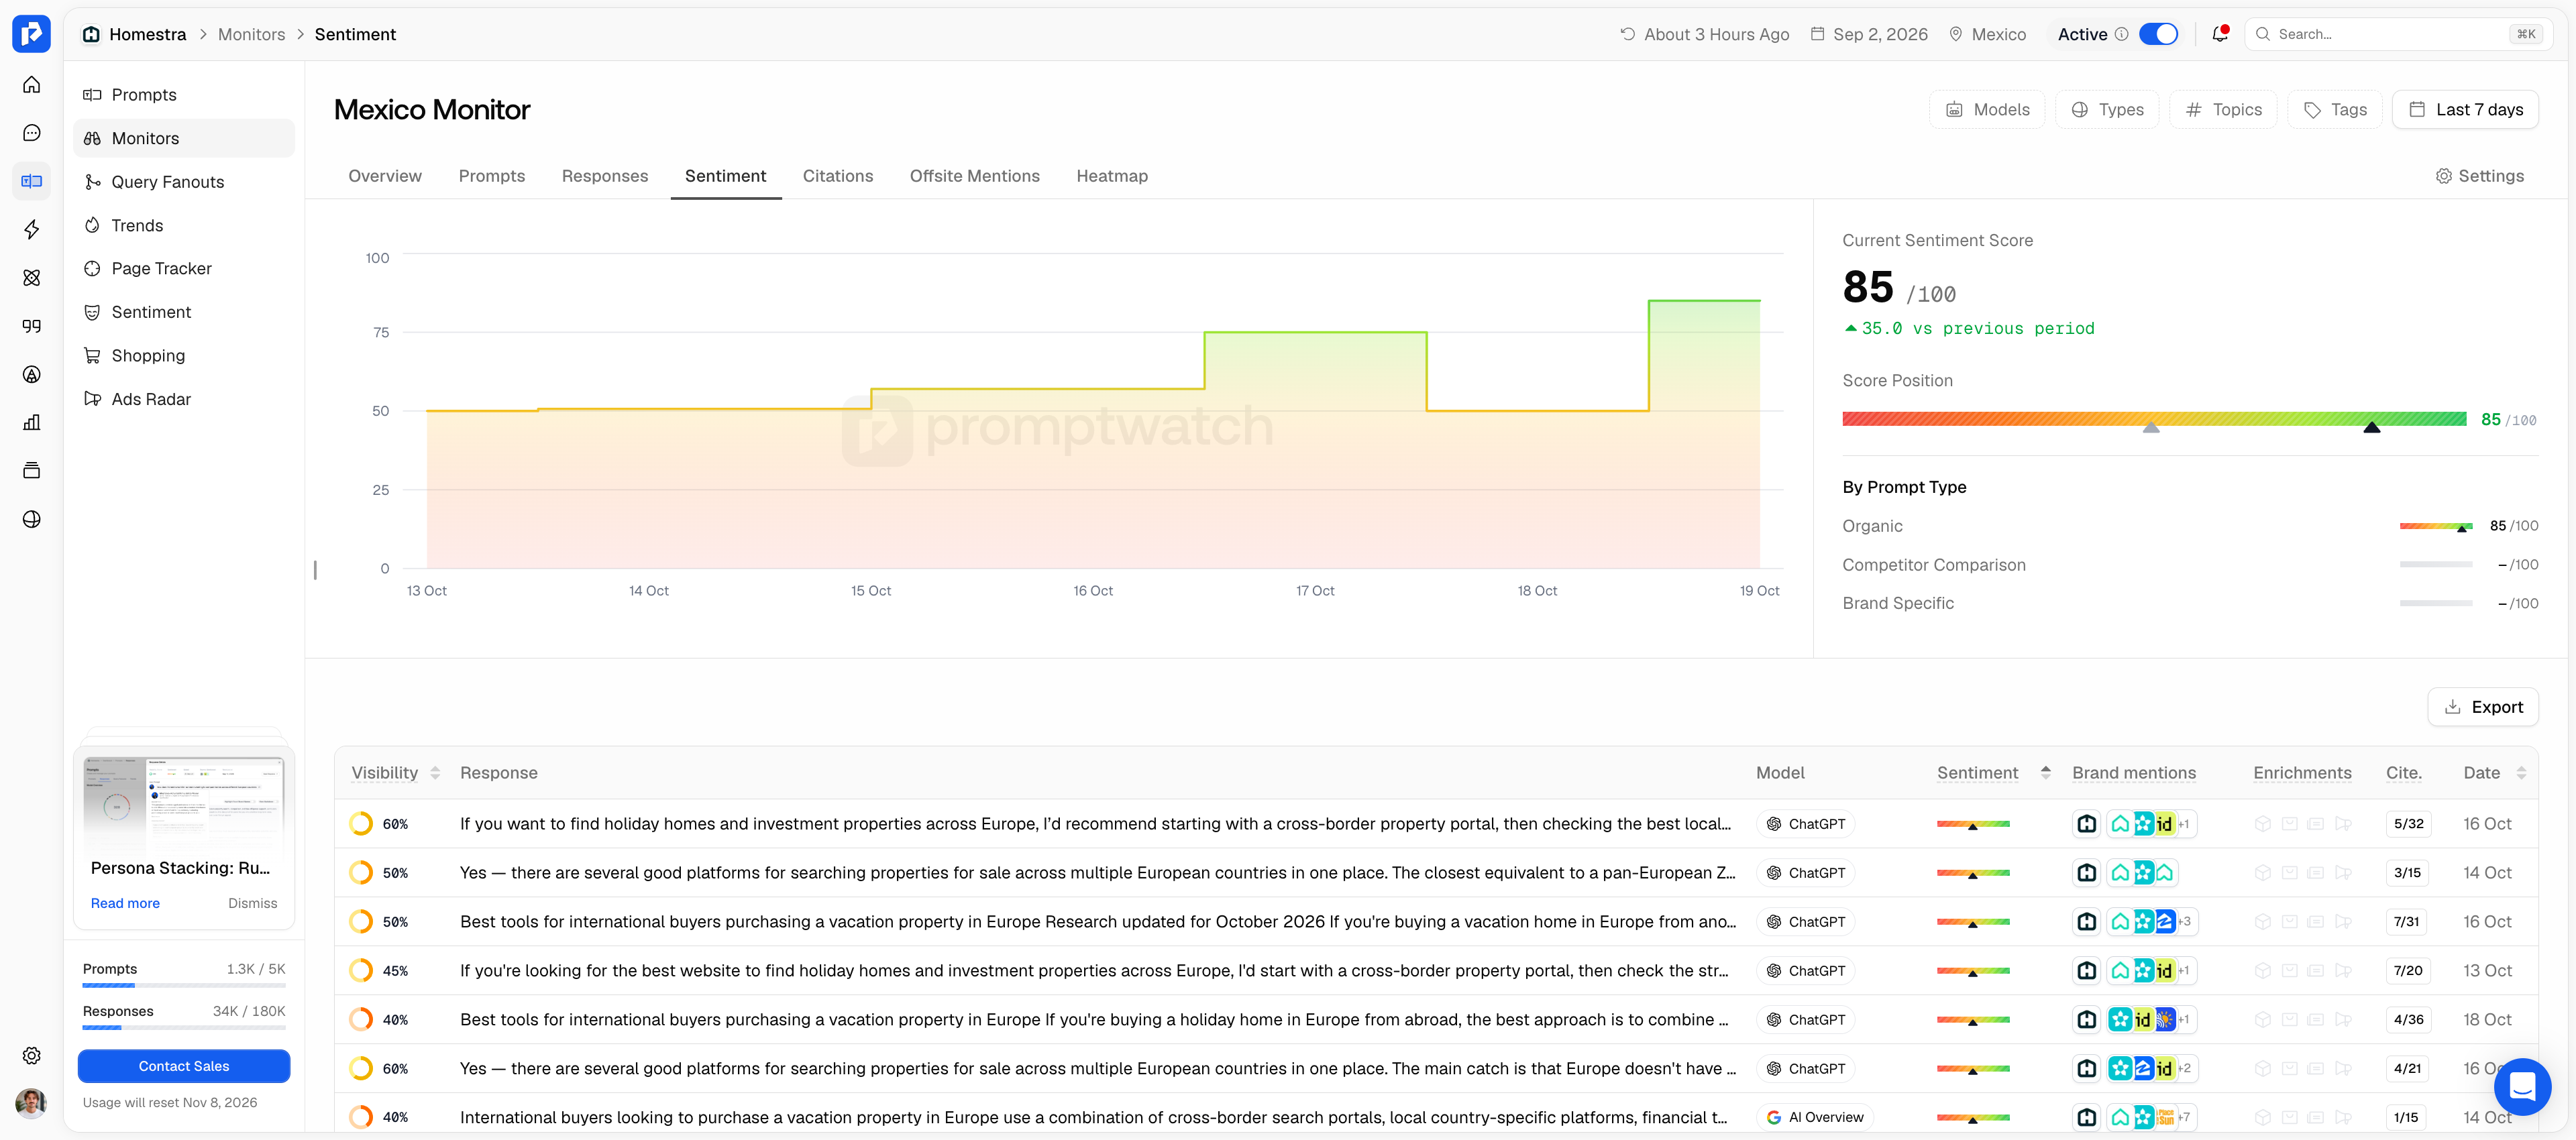
Visibility measures prominence only, so negative tone doesn't lower it. An answer devoted entirely to problems with your product can score in the 90s for visibility, because the brand is the center of the answer. Folding tone into the same number would hide exactly the case you most need to see.
Sentiment is scored separately, from 1 to 100 per response, based only on how the brand is discussed. Brand mentions with no opinion attached are left out of the sentiment average instead of being counted as neutral. Citations are tracked separately too, because being named in an answer and being the source the answer links to are two different wins (see LLM brand sentiment monitoring for how the two signals work together).
AI visibility score vs mentions, share of voice and citations
Each metric answers a different question about the same set of AI responses:
| Metric | What it counts | What it misses |
|---|---|---|
| Mention | Any response that includes the brand (three mentions in one answer = 1 mention) | Placement, tone, and whether the mention said anything |
| Citation | A response that links to a page as evidence | Brand mentions without a link |
| Share of voice | Your share of brand mentions relative to named competitors | How often the category conversation happens at all |
| Visibility score | Prominence across all analyzed responses, absences as 0 | Tone (tracked in sentiment) |
You can hold a large share of voice in a conversation that barely happens. You can be cited as a source while a competitor gets the recommendation. The visibility score is the one metric of the four that reflects both how often you appear and how well.
Why is my AI visibility score different in every tool?
Run the same brand through four platforms and you'll get four numbers. Prospects in Promptwatch's ~150-call research repeatedly reported a 5 to 15% difference between Promptwatch's score and the score from a competing tool. That gap is expected, and it comes from six choices every tool makes differently.
Different prompt sets
The prompt set is the largest factor, and the one you control. A set full of branded prompts ("is Acme good for small teams?") inflates the score, because a model asked about your brand will mention it. Teams that choose prompts to track from real buyer questions get a score that means something.
"It's useless to measure yourself on branded test prompts, because you're always visible. Your main goal for acquiring new customers is the non-branded prompts." Koen Gijsman, Web Analyst at Zilveren Kruis (Achmea)
Promptwatch tags every prompt as Organic, Brand Specific or Competitor Comparison, so you can read the score for non-branded prompts on its own.
Different engines and markets
ChatGPT, Gemini, Perplexity, Claude and Google AI Overviews cite different sources and favor different brands. A score built on two engines and a score built on five measure different markets. The same applies to geography: AI answers change by country, language and city, so a US-English score says little about Germany.
Different collection methods
Some tools query an engine's API, others load the real interface a user sees. API responses can differ from the live product in localization, ordering and citations. Promptwatch collects answers from the real interfaces of each engine, which is the core question behind AI search monitoring API comparisons.
Different run counts
AI engines don't return the same answer twice. Run one prompt five times and the brand order, the cited sources and sometimes the brands themselves change between runs. A score built from one run per prompt per month is a single sample of a moving target.
Reliable scores come from repeated runs: each prompt tested on a schedule, results stored, and the trend read across weeks. Promptwatch runs every monitor daily by default on every plan, which is what makes the Avg view across a date range stable enough to act on.
Different absence handling
This is the 67.2 versus 33.6 gap from the table above. A tool that averages only the answers you appear in will always report a higher number than one that counts every answer.
Different normalization
Some scores are absolute, others are indexed against a competitor set or the category leader. An indexed score can fall while your real presence grows, simply because a rival grew faster.
The practical rule: compare one tool against itself over time, and never compare a number from one tool with a number from another.
Why does my AI visibility score change when nothing on my site changed?
A score can move overnight with no change on your side, for four common reasons:
- The engines changed. Models re-crawl, re-index and update constantly, so a single day's answers can shift on their own.
- Competitors moved. A rival publishing a strong comparison page can take placement from you in answers you didn't lose any content for.
- Your content aged. Promptwatch's data shows citation relevance tends to hold for roughly 8 to 14 weeks before a refresh helps, with no ranking drop or error to warn you.
- Your prompt set changed. Adding prompts where you're weaker lowers the average immediately.
"One piece of advice: please don't give your CEO access to Promptwatch. We added more prompts, our score dropped from about 65 to 40, and while I was on holiday our CEO went into total panic, thinking the website was broken. It wasn't." Dave Vollebregt, Head of Marketing at TreeHouse
Annotate prompt-set changes when you make them, and judge the score on its trend over several weeks.
What is a good AI visibility score?
A good AI visibility score is one that beats your closest competitors on your own prompt set and rises over time. No universal benchmark exists, because the number depends on the prompt set, the engines, the market and the tool's method, all of which differ between teams.
Competitive density matters most. Reaching 50 in a crowded category like CRM, where ten vendors share every answer, is a bigger achievement than reaching 50 in a niche with three rivals. Promptwatch's competitor heatmap puts your score next to each named competitor on the same prompts, which is the comparison that holds up.
Read the score next to the metrics it doesn't cover: sentiment, citations, and AI-referred traffic. Promptwatch's guide to AI visibility KPIs covers which of those to put in front of leadership.
How to improve your AI visibility score
The fastest gains come from the responses currently scoring zero, since moving one answer from 0 to 50 lifts the average more than moving one from 65 to 80.
- Fix absence first. Find the prompts where you don't appear at all. Prompt tracking shows each prompt's responses side by side with competitors, so the gaps are visible per prompt.
- Earn placement with comparison content. List-shaped, comparison-shaped content with clear criteria is what models pull to the top of a generated answer.
- Give the model something to say. Responses where the model admits it doesn't know you score 0. Consistent descriptions across your site, review platforms and directories give it facts to use.
- Check that AI crawlers can reach your pages. Blocked bots, 403s and rate limits cap everything above them. AI crawler logs show which bots fetch which pages and what status code they get.
- Work the third-party sources. Much of what feeds AI answers is review sites, forums and community threads. AI mention tracking Reddit data shows which threads get cited for your prompts.
- Turn gaps into pages. A content agent drafts articles from your own citation and content-gap data, and every draft goes to a review inbox before anything publishes.
FAQ
Is an AI visibility score the same as share of voice?
No. Share of voice is your proportion of brand mentions relative to named competitors. The visibility score is your absolute prominence across all analyzed responses, with absences counted as zero, so you can hold a large share of a conversation that rarely happens.
Can a negative AI answer still give me a high visibility score?
Yes. Visibility measures prominence only, so an answer focused entirely on problems with your product can score in the 90s. That answer shows up in your sentiment score instead, which Promptwatch calculates separately on a 1 to 100 scale.
Does "I'm not familiar with this brand" count as a mention?
In Promptwatch, no. Responses where the model says it has no information about the brand score 0, as do responses where the brand appears only in a cited source title.
Can I compare my AI visibility score across two tools?
No. Tools differ in prompt sets, engines, collection method, run counts and absence handling, and prospects report gaps of 5 to 15% between tools for the same brand. Compare one tool against itself over time.
How often should an AI visibility score be measured?
Daily collection with weekly review works for most teams. Single answers vary from run to run, so a score built from repeated daily runs and read as a multi-week trend is far more reliable than a monthly snapshot.
Can I combine several brand names into one AI visibility score?
Yes. Brand merging in Promptwatch rolls multiple brand names, entities or product lines into one brand's visibility tracking and reporting.


