TL;DR
- No single website owns AI search. Reddit was the most-cited domain in ChatGPT Search in June 2026 at 3.71% of citations, about six times Wikipedia (0.56%), and no domain passed 4%.
- Google increasingly cites itself. google.com took 7.31% of Google AI Mode citations in June 2026, more than YouTube and Reddit combined, and 2.30% of AI Overview citations, six times its January share.
- Product pages are the most-cited format. They made up 32.8% of ChatGPT citations in July 2026 and overtook listicles in Google AI Overviews at the end of that month (17.9% vs 16.2%).
- Platforms move citations overnight. ChatGPT cut its average citations per answer by 27% the day GPT-5.3 rolled out, and Reddit's share of ChatGPT Search citations fell 86% in a single week in August 2026.
- The crawler mix is changing fast. OpenAI's share of verified AI crawler requests fell from 94.8% to 79.8% in under three months, while Meta-WebIndexer went from about 2% to 37.8%.
- Ads are now part of the answer. ChatGPT showed ads in 20.1% of search responses over 90 days, and in 32.4% by mid-August 2026.
Every statistic on this page comes from Promptwatch's own data: more than 26 billion citations, prompts, and responses collected from the real interfaces of ChatGPT, Google AI Overviews, Google AI Mode, Perplexity, Claude, and Gemini, plus IP-verified AI crawler logs. Each figure links to the Promptwatch data report it comes from, and every collection window falls between December 2025 and September 2026.
Which websites AI search engines cite
No domain holds more than 4% of ChatGPT Search citations
In Promptwatch's June 2026 ChatGPT citation share report (June 1 to 27), Reddit led with 3.71% of all ChatGPT Search citations, down from 6.11% in May. Wikipedia followed far behind at 0.56%. Among the risers, GitHub moved from 0.23% to 0.27% and Trustpilot from 0.18% to 0.22%, while LinkedIn also gained.
The practical read: citation share in ChatGPT is spread across a very long tail. Even the most-cited domain on the web appears in fewer than 4 of every 100 citations, which leaves room for specialized sites to win the questions in their own category.
Google is now the most-cited source in its own AI Mode
In Google AI Mode, google.com reached 7.31% of all citations in June 2026, more than YouTube (2.88%) and Reddit (2.52%) combined.
| Domain | May 2026 | June 2026 | Change |
|---|---|---|---|
| google.com | 4.24% | 7.31% | +72% |
| YouTube | 3.42% | 2.88% | −15.8% |
| 2.36% | 2.52% | +6.8% | |
| 0.57% | 0.68% | +19% | |
| Quora | 0.12% | 0.18% | +50% |
Every other domain sat below 1%. June was also YouTube's first decline in the series.
In AI Overviews, YouTube, Reddit, and google.com hold over 9% of citations
The same pattern is building in Google AI Overviews, just more slowly:
| Domain | May 2026 | June 2026 |
|---|---|---|
| YouTube | 3.74% | 4.16% |
| 2.52% | 2.72% | |
| google.com | 1.15% | 2.30% |
| Quora | 0.17% | 0.24% |
| Wikipedia | 0.10% | 0.15% |
| Gartner | 0.13% | 0.11% |
| TikTok | 0.13% | 0.10% |
The top three domains held over 9% of AI Overview citations in June, roughly double their combined share in January. google.com grew sixfold in five months, from 0.37% in January to 2.30%, and Google properties overall accounted for about 6.5% of AI Overview sources, a level of self-reference with no equivalent in ChatGPT.
In some industries, marketplaces outrank every brand
Category data shows who AI actually trusts for commercial questions. In Promptwatch's automotive report for August 2026, Autotrader led ChatGPT citations at 5%, followed by Cars.com at 4.6%. Chevrolet (2.62%) was the only manufacturer in the top eight, and Reddit ranked ninth at 1.34%.
- Marketplaces and listings: 14.65% of automotive citations combined
- Reviews and research sites: 12.62%
- Manufacturer sites: 7.92%
- Community, news, dealerships, service, and finance: 2.12%
For brands, the implication is uncomfortable but useful: in categories like this, being described accurately on the marketplaces and review sites AI already trusts can matter more than anything on your own domain.
Which content formats get cited
Product pages make up a third of ChatGPT citations
ChatGPT's citation mix in July 2026 skews heavily toward commercial content:
| Content type | Share of ChatGPT citations, July 2026 |
|---|---|
| Product pages | 32.8% |
| Listicles | 9.7% |
| News articles | 5.2% |
| How-to guides | 4.1% |
| Social posts | 4.1% |
| Comparison pages | 2.9% |
| Video | 0.1% |
Product pages grew from about 18% of ChatGPT citations in March to 33% by July. Listicles were the fastest-growing format within July itself, climbing from about 8% to just over 10%, while video barely registers in ChatGPT at all.
Product pages overtook listicles in Google AI Overviews
Google AI Overviews cite a more even mix:
| Content type | Share of AI Overview citations, July 2026 |
|---|---|
| Listicles | 18.0% |
| Product pages | 16.3% |
| How-to guides | 15.1% |
| News articles | 13.5% |
| Video | 5.9% |
| Social posts | 5.1% |
| Landing pages | 4.7% |
| Comparison pages | 3.6% |
The monthly average hides the turning point. From July 28 onward, product pages were the most-cited format every single day, ending the month at 17.9% against 16.2% for listicles. Listicles had averaged about 26% of AI Overview citations in Q1 2026. Video more than doubled, from about 2.7% in January to 6.3% by late July, while how-to content held steady near 15%. There's a fuller breakdown in are listicles still relevant in 2026.
HTML beats markdown about 2,000 to 1
In a seven-day sample of 1,665,674 citations across ChatGPT, Claude, Perplexity, and Google AI Overviews, markdown files made up just 0.05% of everything cited, against 99.94% for HTML pages (February 2026). Consumer AI search cites the page people read, not a machine-only copy of it.
Social and community platforms in AI answers
Reddit's ChatGPT citations fell 86% in one week
Reddit averaged 3.83% of ChatGPT Search citations between July 18 and August 7, 2026. On August 14, its share collapsed, averaging 0.52% from August 14 to 17, an 86% relative drop. Google's surfaces moved far less over the same weeks:
| Platform | Before | After | Relative change |
|---|---|---|---|
| ChatGPT Search | 3.83% | 0.52% | −86% |
| Google AI Mode | 2.22% | 1.54% | −30.5% |
| Google AI Overviews | 2.37% | 2.10% | −11.3% |
For ChatGPT, "before" is July 18 to August 7 and "after" is August 14 to 17. For Google AI Mode and AI Overviews, "before" is July 1 to 7 and "after" is August 11 to 17. The ChatGPT drop followed a change in how ChatGPT searches, covered below. The full story is in why ChatGPT stopped citing Reddit.
YouTube citations come from small channels and older videos
In February 2026, YouTube's share of citations was 2.74% in Perplexity and 2.25% in Google AI Overviews, but only 0.05% in ChatGPT. The videos being cited are rarely famous:
- About 80% of YouTube citations went to channels with fewer than 100,000 subscribers; channels with over 1 million earned 7%.
- Nearly 80% of cited videos had under 100,000 views, and only 7% had more than 1 million.
- 54% of cited videos were more than two years old; videos under a month old earned about 4% of citations.
For Google's AI surfaces and Perplexity, a clear, specific explainer video is a realistic citation target, even for a small channel.
LinkedIn citations mostly go to articles and posts
Between May 18 and June 17, 2026, LinkedIn citations across AI models split into Pulse articles (37.67%), posts (32.19%), and company pages (13.35%). The mix depends heavily on the engine:
- Google AI Mode: Pulse articles 44.85%, posts 27.37%, company pages 10.71%
- Google AI Overviews: Pulse articles 42.25%, posts 27.72%, company pages 12.86%
- Perplexity: posts 41.88%, Pulse articles 32.46%, company pages 13.09%
- ChatGPT: company pages 23.84%, the LinkedIn homepage 22.55%, Pulse articles 8.77%, jobs 8.02%
See which specific posts get cited with LinkedIn citation tracking.
How AI search engines search before they cite
ChatGPT now runs fewer, shorter searches per answer
Before an AI engine cites anything, it runs its own background searches, called query fan-outs. ChatGPT's fan-out behavior got much leaner over the first half of 2026:
| Period | Fan-out searches per response | Average query length |
|---|---|---|
| Early December 2025 | 2.15 | ~117 characters |
| Early March 2026 | 1.84 | high 80s characters |
| April 2026 onward | 1.0 | ~53 characters |
ChatGPT moved from sentence-like searches to short, keyword-style queries, less than half their original length. Fewer searches means fewer chances for a page to enter the answer.
Then ChatGPT started searching inside specific websites
On August 8, 2026, the share of ChatGPT fan-out queries using the site: operator (a search restricted to one domain) jumped from 0.37% to 16.8% overnight, roughly a 46-fold increase. Average searches per response rose from about 1.08 to 1.83 at the same time, so the site-specific searches were added on top of general web searches rather than replacing them. Six days later, Reddit's citation share collapsed.
Citation volatility is a platform variable
GPT-5.3 cut ChatGPT's citation slots by 27% overnight
ChatGPT cited an average of 6.4 sources per web-search response in the week of February 26, 2026. After GPT-5.3 rolled out on March 4, that fell to 4.7 to 4.9 sources, a drop of about 27%. It hit GPT-5.3, GPT-5.4, and GPT-5-Mini at the same time, happened within a day of the rollout, and had not recovered a month later.
Each engine offers a different number of citation slots
Promptwatch's average sources per response tracker shows how different the competition for a citation is on each platform:
| Platform | Typical sources per answer |
|---|---|
| Google AI Overviews | about 10, very stable |
| Perplexity | almost exactly 10, day after day |
| ChatGPT | about 5 (4.7 to 4.9 after GPT-5.3) |
| Microsoft Copilot | swings between under 2 and nearly 17 within weeks |
A ChatGPT answer has roughly half the citation slots of an AI Overview or Perplexity answer, so each slot is harder to win.
Citations decay after 8 to 14 weeks
Across Promptwatch's data, citation relevance typically holds for roughly 8 to 14 weeks before a content refresh helps. Models re-crawl and re-index regularly, so an unchanged page can lose citations with no ranking drop, no technical error, and no traffic cliff to flag it.
Put together, these numbers change how AI visibility should be read. A drop in citations can be a platform event rather than a content problem, and a single snapshot says very little. Track the same prompts over weeks with prompt tracking before deciding what to fix.
"Visibility and sentiment are great starting points, but you have to look beyond that. You have to look at the patterns. Only by diving deeper do we actually discover the issue." Iain Davenport, Director of Business Solutions at Monks
AI crawler statistics
OpenAI's share of verified AI crawler traffic fell 15 points in three months
Counting only requests whose IP matches the operator's published ranges, OpenAI accounted for 94.8% of verified AI crawler requests in the week of June 8 to 14, 2026, and 79.8% in the week of August 31 to September 6. OpenAI didn't slow down: Anthropic, Google, Perplexity, and Mistral took a growing share.
Meta-WebIndexer became the heaviest AI crawler in a month
Meta-WebIndexer, the crawler behind Meta AI's search results, went from about 2.2% of tracked AI crawler requests in mid-July 2026 to 37.8% on August 9, roughly a 17-fold increase. In a few weeks it went from 1 in 50 AI crawler requests to more than 1 in 3.
Claude's citation crawler grew more than 100-fold
Claude's citation crawler visits went from about 30 a day in mid-December 2025 (0.04% of tracked AI citation crawler traffic) to a peak of 1.73% on April 13, 2026. Daily visits jumped from the hundreds into the thousands within two weeks in late March. At 1.09% on April 19, Claude is still small next to ChatGPT, but the growth marks a genuinely new source of AI citation traffic.
What 30 days of crawler traffic looks like on one site
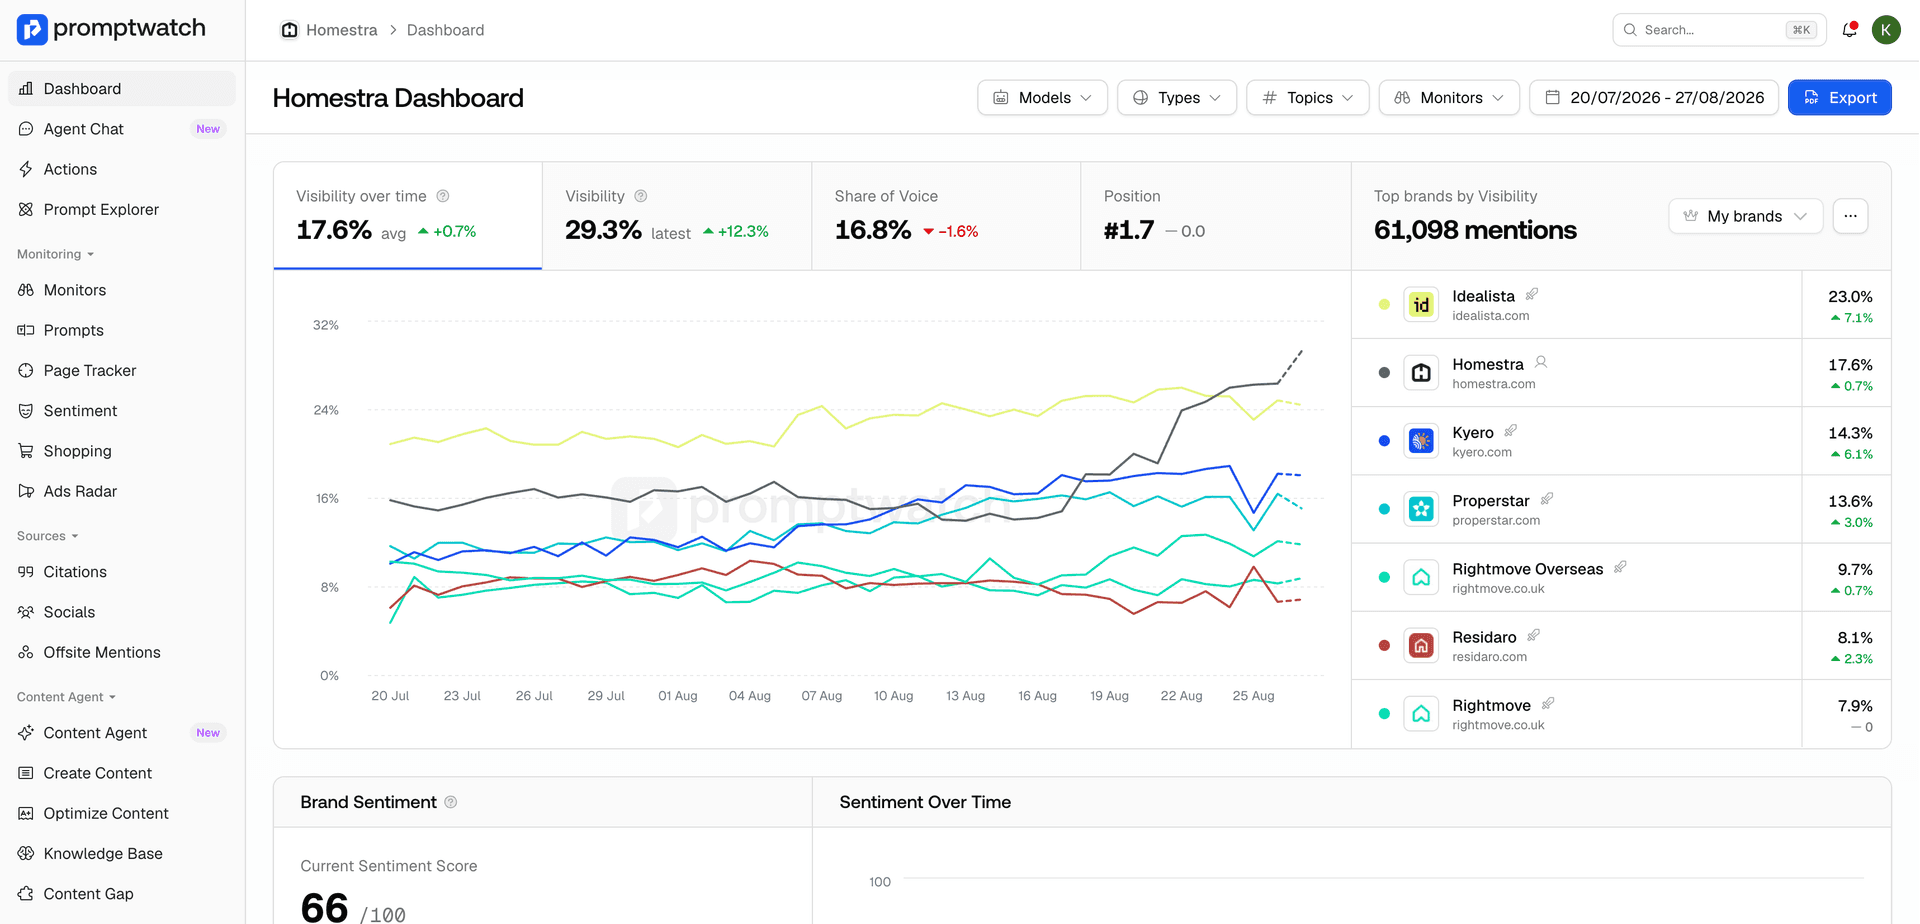
On Homestra, a European real estate marketplace using Promptwatch, AI crawlers made 71,060 requests between August 3 and September 1, 2026, about 2,369 a day, with daily volume swinging from roughly 1,000 to over 5,400.
| Crawler | Share of AI crawler requests |
|---|---|
| ClaudeBot | 30.3% |
| ChatGPT-User | 28.5% |
| meta-externalagent | 12.7% |
| GPTBot | 11.9% |
| PerplexityBot | 7.3% |
| OAI-SearchBot | 6.1% |
| All others | about 3.3% |
ChatGPT-User, which fetches pages live when someone asks ChatGPT a question, requested each property page about 2.5 times on average, against 1.5 times for ClaudeBot's training sweep. Meta-WebIndexer hit a 404 on 14.8% of its requests, nearly four times the site's 3.9% average. These are single-site figures, but they show what Agent Analytics surfaces from your own CDN logs.
Ads in ChatGPT answers
Ads first appeared in Promptwatch's ChatGPT data on May 27, 2026, in 1.69% of search responses. By July 1, the rate had passed 30%, and it peaked at 43.9% on a single day. Over the 90 days from May 20 to August 17, ads appeared in 20.1% of ChatGPT Search responses, with a seven-day average of 32.4% by mid-August.
Most ads appear on questions that don't name any brand:
- Organic prompts (no brand named): 73.3% of ads
- Brand-specific prompts: 18.0%
- Competitor-comparison prompts: 8.6%
Your competitors can now buy a place in the answers you're trying to earn. Here's how to track ChatGPT ads in your category. For a side-by-side comparison of platforms, see the best tool to track ChatGPT ads.
Clicks are the wrong way to measure AI search impact
Click-through from AI answers routinely sits below 0.1% in Promptwatch's data, far below traditional search. That's by design, not a channel failure: most of the value happens inside the response, where a brand gets named, described, and recommended. Judging AI search by clicks alone underestimates it. Citation share, mentions, and visibility score measure what actually happens.
"If we can't define success in clicks, where do we need to look? And if a client doesn't want to change that mindset, you can forget about AI search." Ilonka Karoly, Media Performance Director, Total Search at WPP Media
What these statistics mean for your strategy
- Win your category, not the whole web. With no domain above 4% of ChatGPT citations, specialized sites can own the questions in their niche.
- Invest in product and comparison content. Product pages lead ChatGPT citations and now lead Google AI Overviews.
- Earn presence where AI already looks. Marketplaces, review sites, YouTube, Reddit, and LinkedIn articles carry a large share of citations in many categories.
- Plan for volatility. Platform changes moved ChatGPT's citations per answer by 27% and Reddit's citation share by 86% within days. Read trends over weeks.
- Refresh on a cycle. Revisit important pages every 8 to 14 weeks.
- Check the crawlers. Make sure OpenAI, Anthropic, Meta, Perplexity, and Google crawlers can actually reach your key pages, and that they get a 200.
Methodology
- Source: Promptwatch's dataset of over 26 billion citations, prompts, and responses, collected from the live user interfaces of ChatGPT, Google AI Overviews, Google AI Mode, Perplexity, Claude, and Gemini rather than from APIs, so it reflects what real users see. Figures are aggregated and non-identifiable.
- Crawler data: only requests whose source IP matches the crawler operator's published IP ranges are counted, so spoofed user agents are excluded. Weeks run Monday to Sunday, UTC.
- Scope: ChatGPT figures only include responses where ChatGPT ran a web search. Content-type shares only include citations with a classified content type.
- Dates: every figure carries its collection window. Promptwatch's data reports update continuously, so live pages may show newer numbers than this article; the figures here are as published for the stated period.
- Review cadence: quarterly. Given that citation counts can move by double digits overnight, treat anything older than a quarter as likely to have changed.
Frequently asked questions
What are the most-cited websites in AI search?
It depends on the engine. In June 2026, Reddit led ChatGPT Search with 3.71% of citations, google.com led Google AI Mode with 7.31%, and YouTube led Google AI Overviews with 4.16%. No single domain passed 8% on any platform.
How many sources does ChatGPT cite per answer?
About 4.7 to 4.9 sources per web-search answer since GPT-5.3 rolled out on March 4, 2026, down from 6.4 the week before. Google AI Overviews and Perplexity cite about 10.
Why did my ChatGPT citations suddenly drop?
Often because ChatGPT changed, not your site. Promptwatch recorded a 27% overnight drop in citations per answer after GPT-5.3, and an 86% drop in Reddit's citation share within a week of ChatGPT changing how it searches in August 2026. Compare your trend with platform-wide data before rewriting content.
Which content types get cited most by AI?
Product pages. They were 32.8% of ChatGPT citations in July 2026 and became the most-cited format in Google AI Overviews from July 28, overtaking listicles. How-to guides hold about 15% of AI Overview citations, and video is growing there fast.
Does ChatGPT show ads in its answers?
Yes. Ads first appeared in Promptwatch's ChatGPT data on May 27, 2026. Over the 90 days to August 17 they showed in 20.1% of search responses, and in 32.4% on a seven-day average by mid-August. About 73% of those ads appeared on prompts that didn't name a brand.
Which AI crawlers visit websites the most?
OpenAI's crawlers still made 79.8% of verified AI crawler requests in early September 2026, down from 94.8% in June. Meta-WebIndexer grew fastest, reaching 37.8% of tracked AI crawler requests on August 9, 2026.
Does markdown or llms.txt help AI citations?
Consumer AI search cites HTML pages. Markdown files made up 0.05% of 1.67 million citations in a February 2026 sample, and Promptwatch found no measurable impact from llms.txt.
How often do AI search statistics change?
Constantly. Several figures on this page moved by double digits within weeks, which is why Promptwatch publishes new data reports every month and why a single snapshot of your own AI visibility says very little.