

What the Overview tab shows
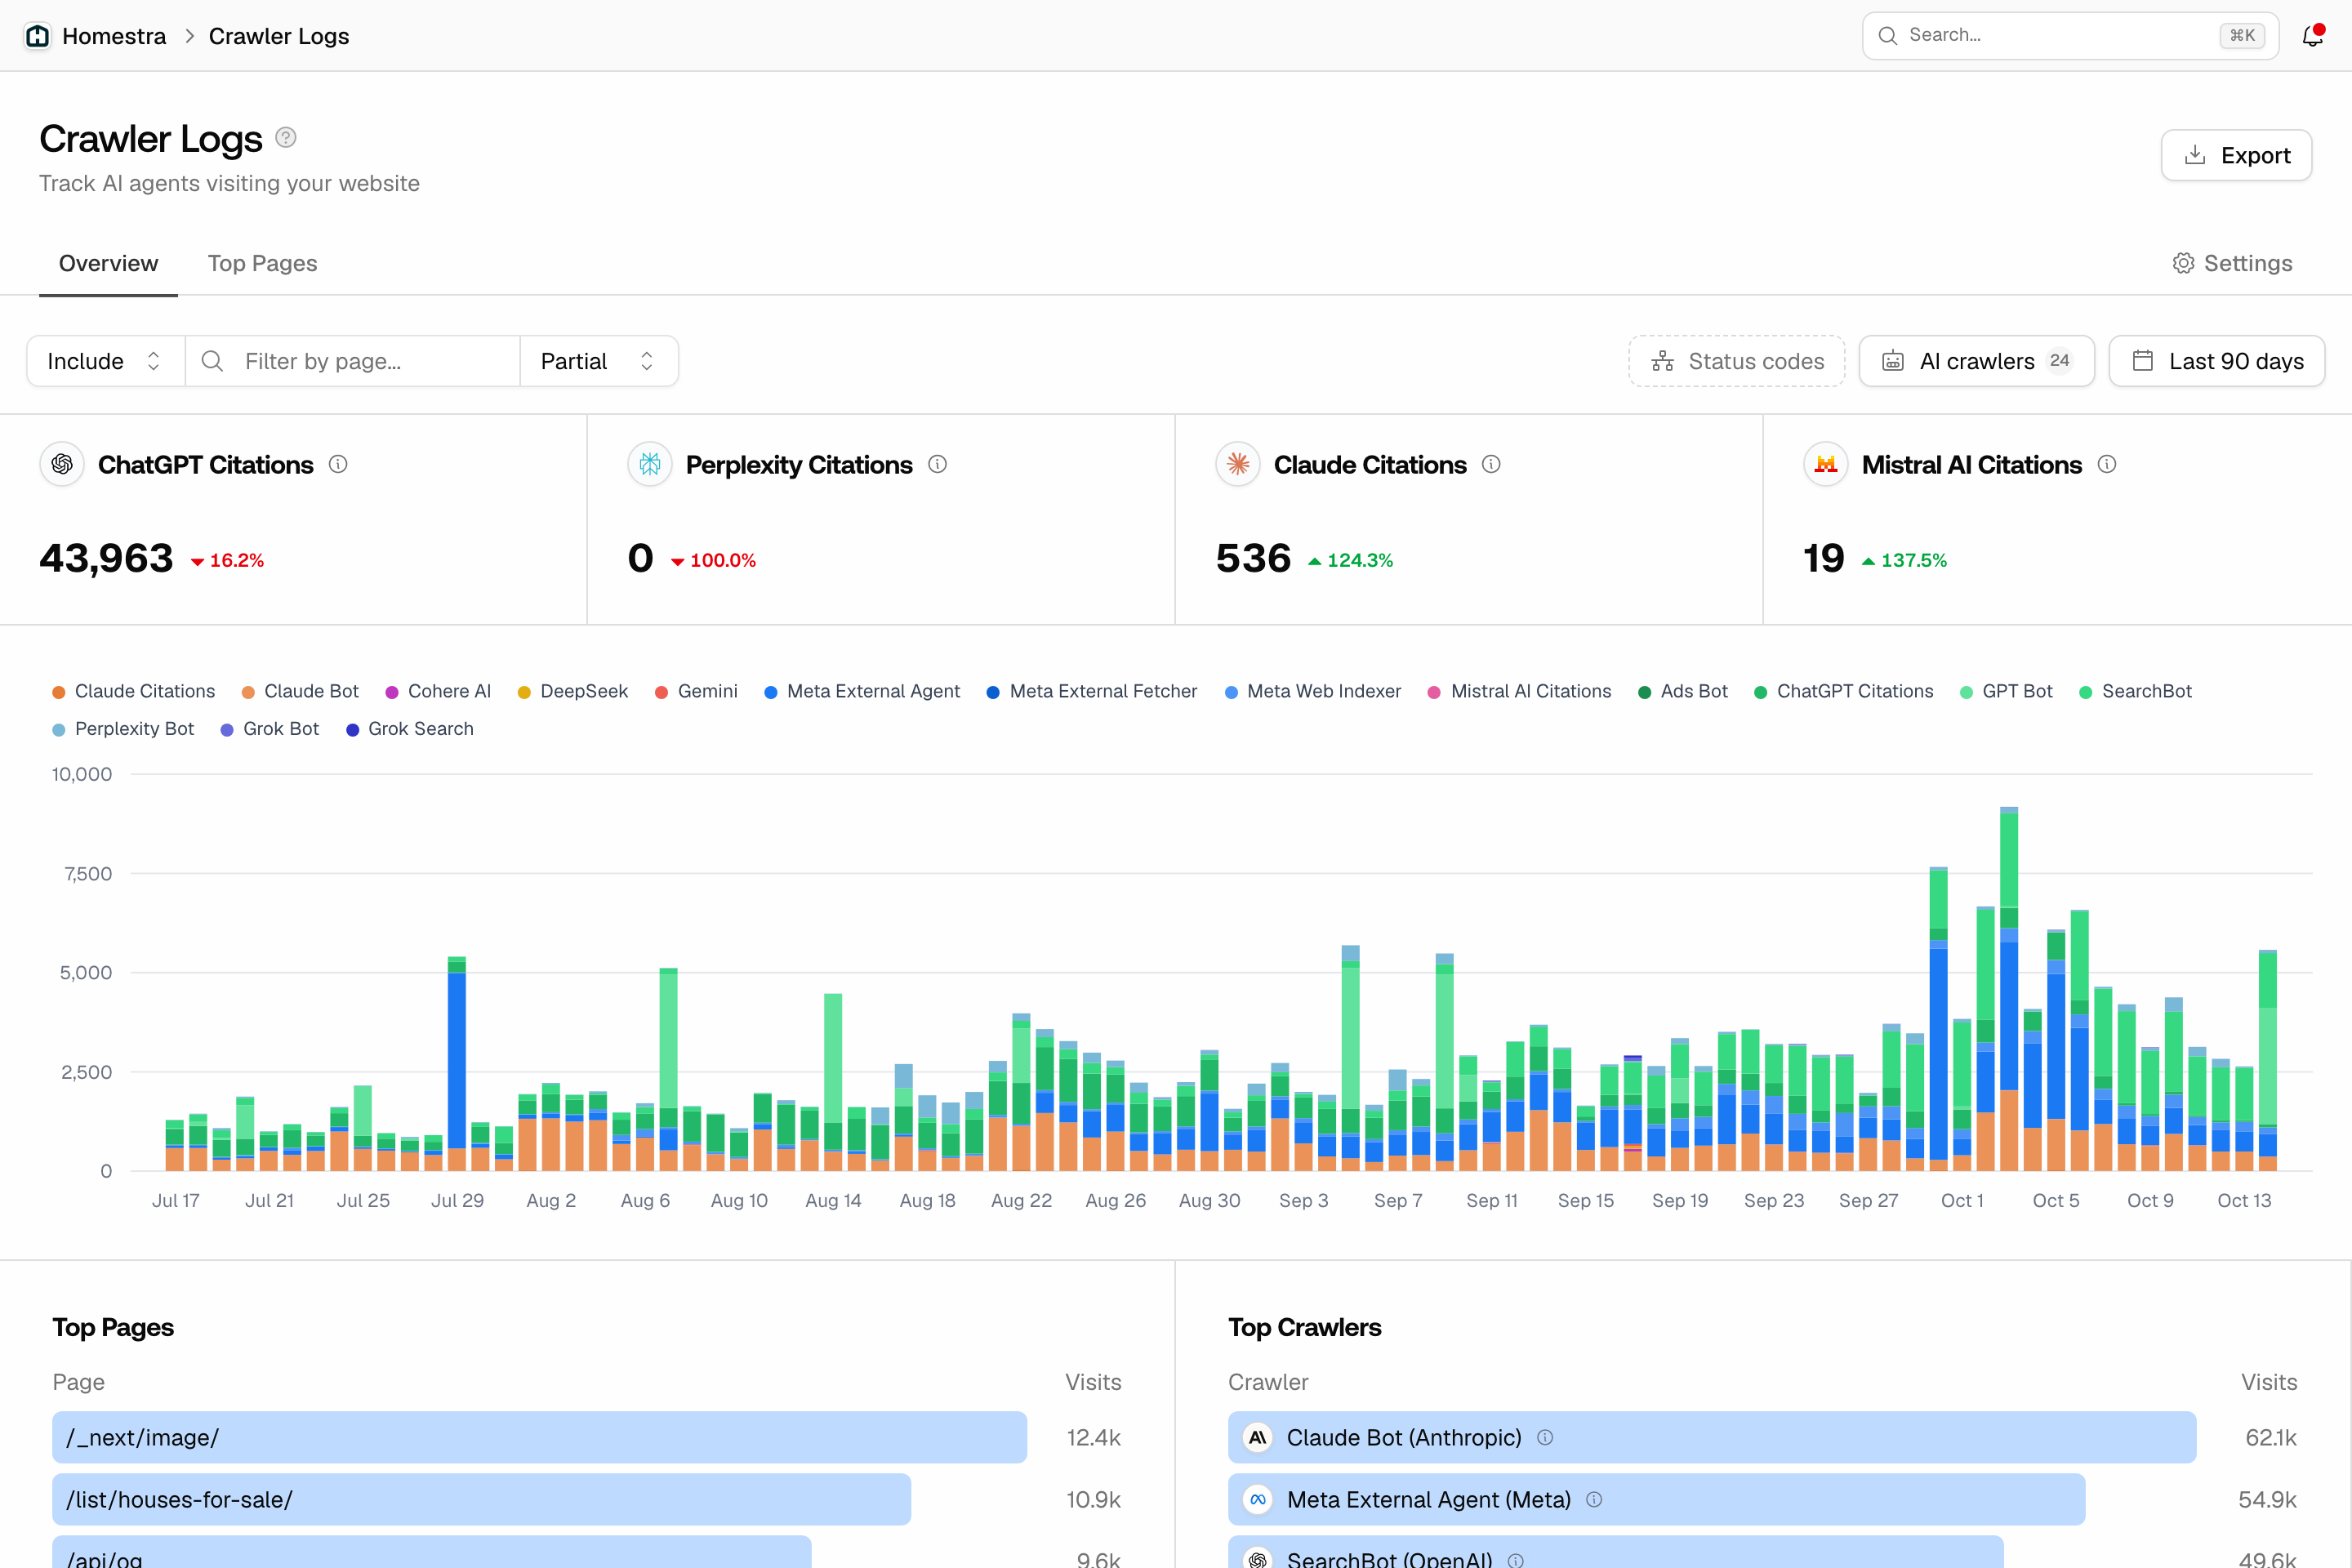
From top to bottom:- Filter bar: a page path filter, Status codes, AI crawlers, and the date range. Every chart and table below obeys the filters, except the four cards, which ignore the AI crawlers filter.
- Four citation cards: ChatGPT Citations, Perplexity Citations, Claude Citations and Mistral AI Citations, each with the number of requests in the range and the percentage change against the previous period. These count visits from each provider’s user-triggered bot (ChatGPT-User fetching a page while answering someone’s question, for example), not citations the model produced in its answers. There is no Gemini card, although Gemini’s crawler appears in the chart and filters. Before any data arrives the cards show blurred with “Waiting for data…”.
- Crawl volume chart: a stacked bar chart of requests per crawler, one bar per day, with a colour per crawler. When the range is 24 hours or less, the bars are per minute instead. There is no separate day, week or month switch; the date range decides the granularity.
- Top Pages and Top Crawlers: side-by-side lists of the most fetched paths and the most active crawlers, each with a visit count. Click a page to open its page summary (file-type entries such as
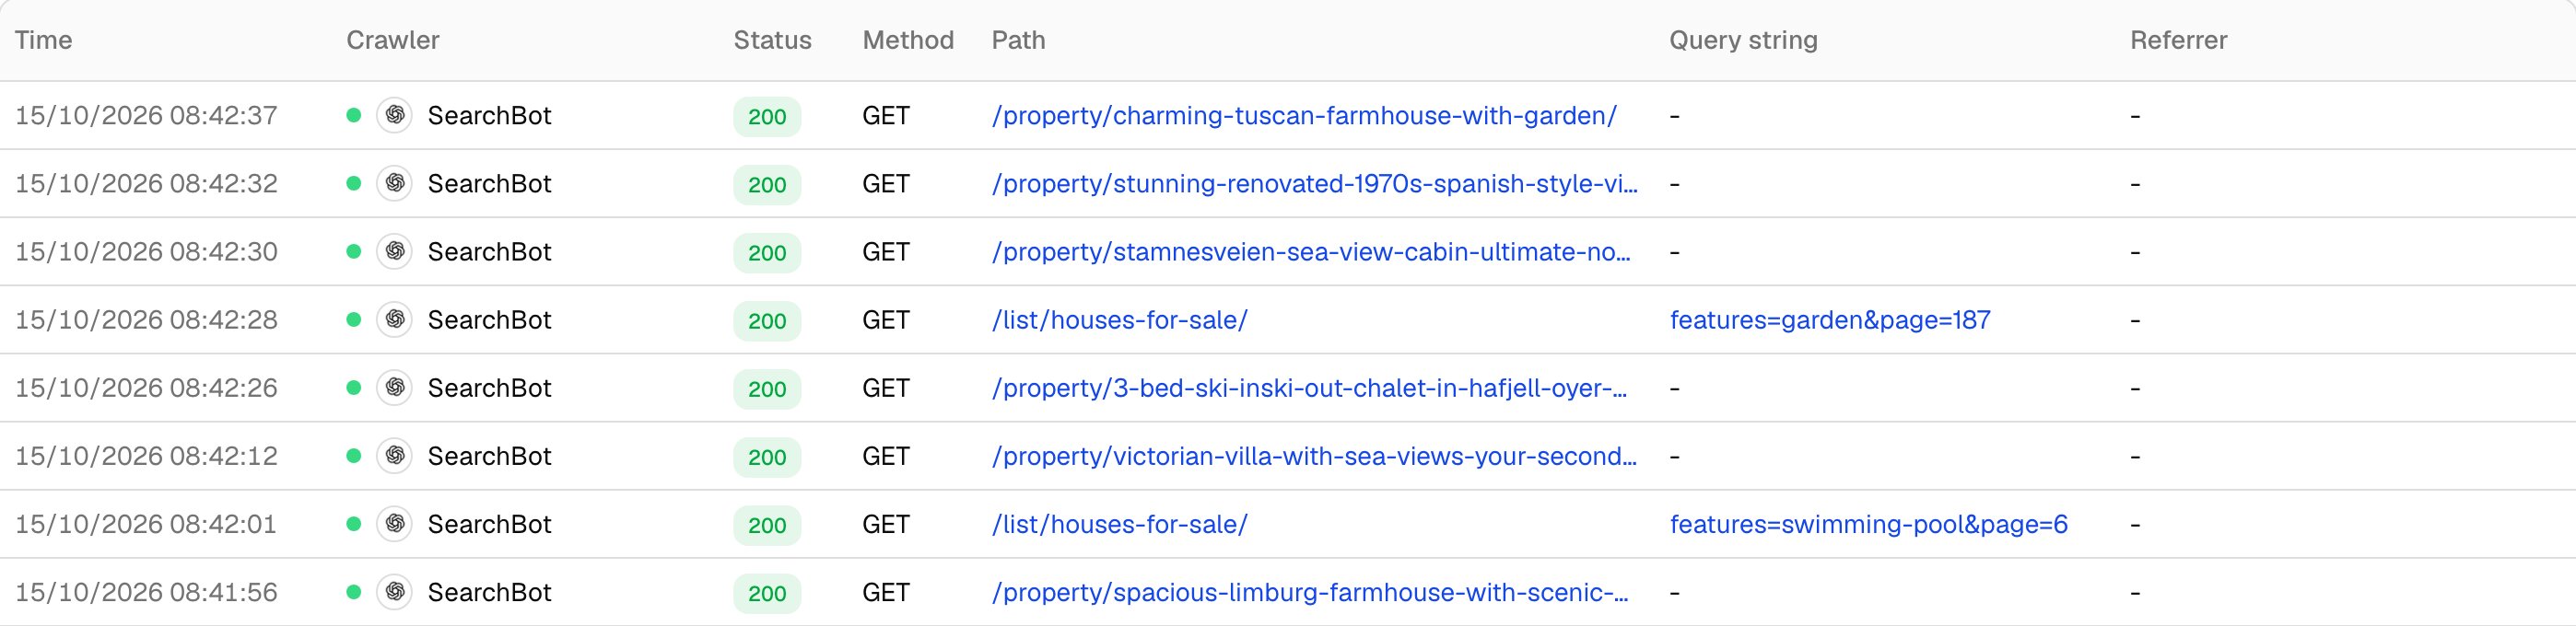
.xml,.pdforrobots.txtadd an exact-path filter instead). Click a crawler to filter the page to it, and click it again to clear. - Logs table: the raw events, 50 per page, refreshing every 10 seconds. The columns are Time, Crawler, Status, Method, Path, Query string and Referrer. Path links to that page’s summary, Status shows red from 400 upwards, and the Crawler column carries a tooltip describing what that bot does.
Training bots, user fetches and search bots
Crawler names look alike, but the tooltips distinguish three jobs, and the difference decides how you read a visit:- Training crawlers such as GPT Bot or Claude Bot collect pages for model training. A visit means the model may learn about your page; it does not mean anyone asked about it.
- User-triggered fetches such as ChatGPT Citations or Claude Citations happen while the assistant answers a real question. These are the visits the four cards count, and the closest thing in the logs to “my page was used in an answer”.
- Search bots such as SearchBot or Claude Search Bot index pages for the assistant’s own search layer.
Filtering down to a problem
- Page path: add up to 10 rules with Include or Exclude and Partial or Exact matching, so you can look at one section of the site or leave out an asset folder.
- Status codes: a multi-select of 15 codes, for example 200 (Success), 301 (Moved Permanently), 302 (Found), 403 (Forbidden), 404 (Not Found), 429 (Too Many Requests) and 500 (Internal Server Error).
- AI crawlers: one or more crawlers, as above.
- Date range: presets from Last 24 hours to Last 90 days, or a custom range.
Turning the logs into opportunities
- Crawled but not cited: compare the Top Pages list with your Citations page (the Sources tile in the left rail, then Citations). A page that user-triggered bots fetch often but that rarely shows up as a citation is being read and rejected: the best candidate for a content update. See Understanding sources and Citations vs. mentions for how citations are counted.
- Fix crawl errors first: filter Status codes to 403, 404, 429 and the 5xx codes. Each of these is a page the model asked for and did not get, so they are lost visibility until fixed.
- Check that nothing is blocked: if one provider’s bots dominate and another’s never appear, the usual cause is access (robots.txt, firewall or CDN rules), not content. Work through Crawlability before changing any copy.
- Keep the most-fetched pages fresh: high crawl frequency shows interest, not authority. Make sure those pages are current, load correctly and answer the question the fetch suggests.
- Watch the trend: spikes often follow a sitemap update or a content refresh. Use the chart as feedback on what changed, and the per-minute view on a 24-hour range when you want to see a single event.