

Step 1: create a project API key
- Go to Settings → API Keys.
- Give the key a name, for example “Looker Studio - Client X”.
- Keep the key type on Project Key (the option labeled “Access to a single project only and Data Studio integration”) and select the project you want to report on.
- Keep the permission on Read-only. The connector only reads data, so there’s no reason to hand it a full-access key.
- Click Create Project API Key. The new key is copied to your clipboard automatically; in the keys table it shows masked, and you can reveal or copy it again later.
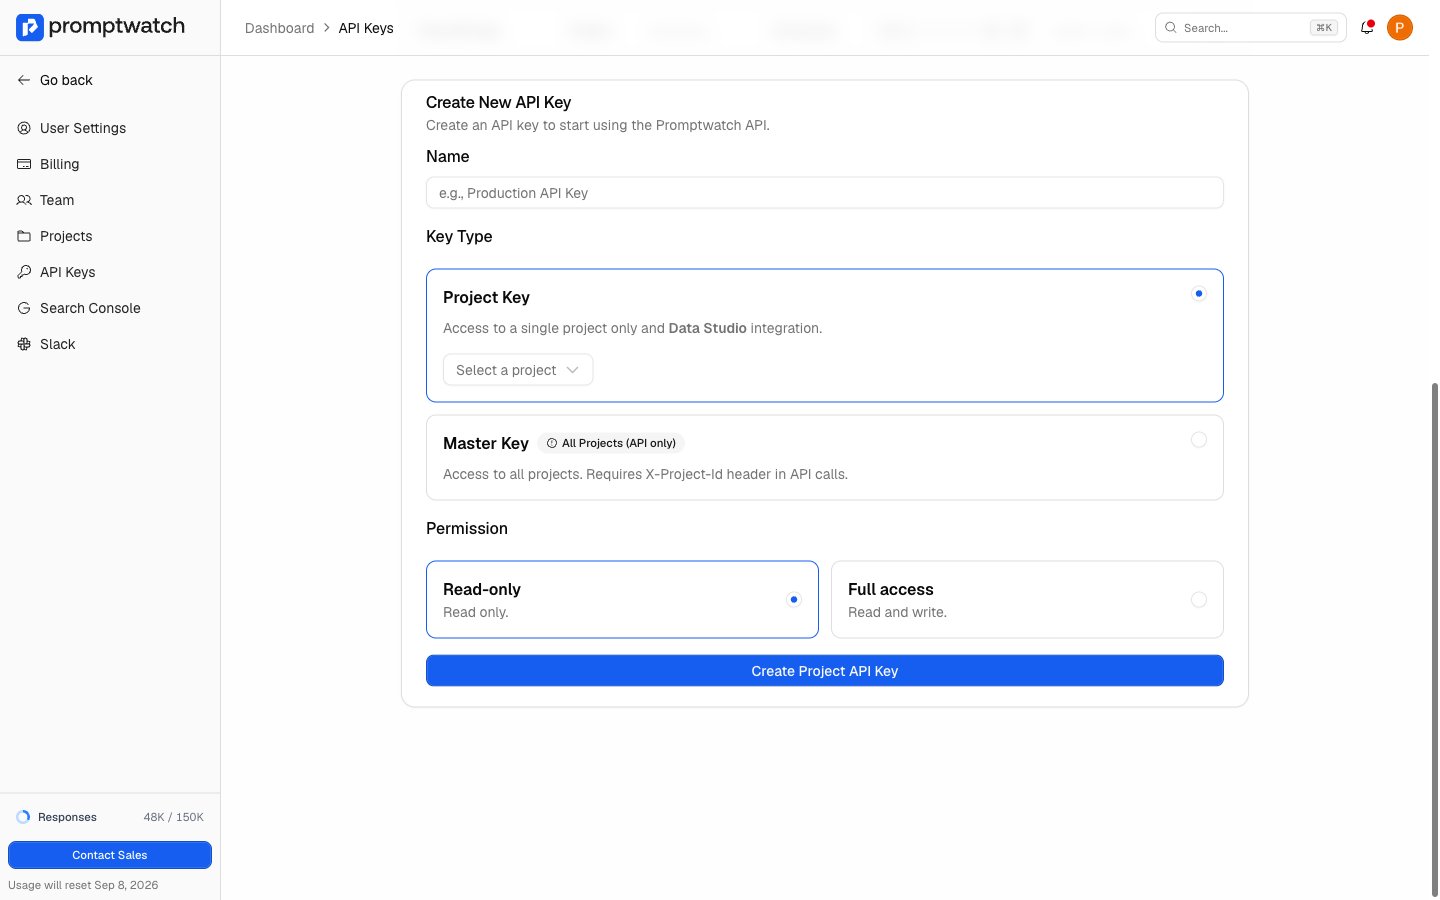
X-Project-Id header on every call; the project key carries its project by itself.
Step 2: add the connector in Looker Studio
- Open the Promptwatch connector in Looker Studio.
- Authorize the connector with your Google account.
- Enter your project API key and connect.
- Create the data source, then add it to a new or existing report.
What data you can pull
The connector reads the v1 API catalog, per project. It covers the core metrics; app-only surfaces like shopping, ads, and content are not exposed:- Visibility: your brand visibility score as a time series, grouped by day, week, or month, filterable by model, monitor, or a single prompt.
- Sentiment: sentiment scores over time, plus the sentiment distribution across responses.
- Share of voice: your share of brand mentions as a time series, plus a comparison of the current period against the previous one.
- Responses and mentions: total responses, brand mentions over time, and your top competitors by mentions.
- Citations: citation analytics, self-citation frequency, cited domains over time, citation rank analysis, your top cited pages, and which sources and domains each model cites.
- Competitor heatmap: the model-by-brand visibility matrix.
- Prompts and monitors: the prompt and monitor lists behind the numbers, useful as report dimensions.
- Crawler and visitor analytics: AI crawler activity trends and top crawled pages, plus visit totals and trends from visitor analytics.
How fresh is the data
The API serves reads from a short server-side cache; the window varies per endpoint, from a couple of minutes for visibility and sentiment up to longer windows for slow-moving data like monitors and models. Looker Studio adds its own data freshness interval on top, which you control per data source. The result is current enough for reporting; it’s not a live-refresh feed.Troubleshooting
- “Invalid API key”: the key was mistyped or has been deleted. Copy it again from Settings → API Keys, or create a new one; deleting a key breaks every data source built on it.
- “API access is not available on your current plan”: your organization’s plan no longer includes API access. Upgrading restores existing keys without recreating them.
- The numbers are for the wrong website: the key is project-scoped, so the data source shows whichever project the key was created for. Create a key under the right project and reconnect.
- Requests failing under heavy use: API calls share your organization’s rate limits across all keys, enforced per second, minute, and hour. A report with many charts refreshing at once can hit the short windows; the response says when to retry, and the rate limits page lists the numbers per plan.