

Month 1 (days 1-30): establish a baseline you can trust
Everything you do later is measured against this month’s numbers, so the goal is representative data, not good news. Resist the urge to act on week-one numbers; a baseline built on three days of data mostly measures noise.Week 1: set up the measurement
- Create your project and complete onboarding. Setup analyzes your website and prefills your brand profile and competitor suggestions.
- Audit the Brand Book: name, domain, and especially aliases, every name your brand actually goes by, since detection can only credit names it knows. See your brand profile.
- Set your competitor list to the brands a customer would genuinely shortlist against you, no more. Competitors are the comparison set on the heatmap and the Brand Visibility chart, so a padded list buries the comparisons you actually care about. See identifying your competitors.
- Build your monitors. The three-monitor structure is a solid default, and one market per monitor keeps your time series clean. Aim for around 15 prompts per monitor, sourced from real customer language. See finding the right prompts.
- Select models: ChatGPT, Perplexity, and AI Overview are the core three; add others deliberately, since each model multiplies response usage. See choosing your models.
Week 2: connect the data sources
Prompt tracking tells you what models say. The other two data legs tell you what models read and what traffic they send:- Sitemap or Search Console: the index of your own content, and the prerequisite for content gap analysis. See sitemap or GSC connection.
- Crawler logs: what GPTBot, ClaudeBot, PerplexityBot, and the rest actually fetch from your site. See log ingestion.
- Visitor analytics: the human click-throughs your AI visibility produces. See visitor analytics.
Weeks 3-4: let it accumulate, and only fix setup
Read the dashboard weekly, not daily. The only changes worth making now are setup corrections, a missed alias, a wrong monitor country, a prompt that turned out to be too generic, because every setup fix this month is a distortion you don’t carry into your baseline. The common setup mistakes page is the audit list. At day 30, record your baseline: Visibility Score and Share of Voice overall and per model, self-citation rate, and your position on the competitor heatmap. These are the numbers day 90 gets compared against.Month 2 (days 31-60): diagnose, then close the biggest gaps
With 30 days of data, differences are now signal. This month converts them into shipped work.Diagnose where you lose
- Per model, not blended: filter the dashboard by each model. The platform where you’re weakest is usually where the cheapest wins live. See metrics overview for reading the metrics together.
- Per competitor: the competitor heatmap shows who beats you on which model, which is a sharper question than “how are we doing”.
- Per prompt: sort prompts by visibility, then open a prompt and read its responses. Who gets named instead, and which sources do those answers cite?
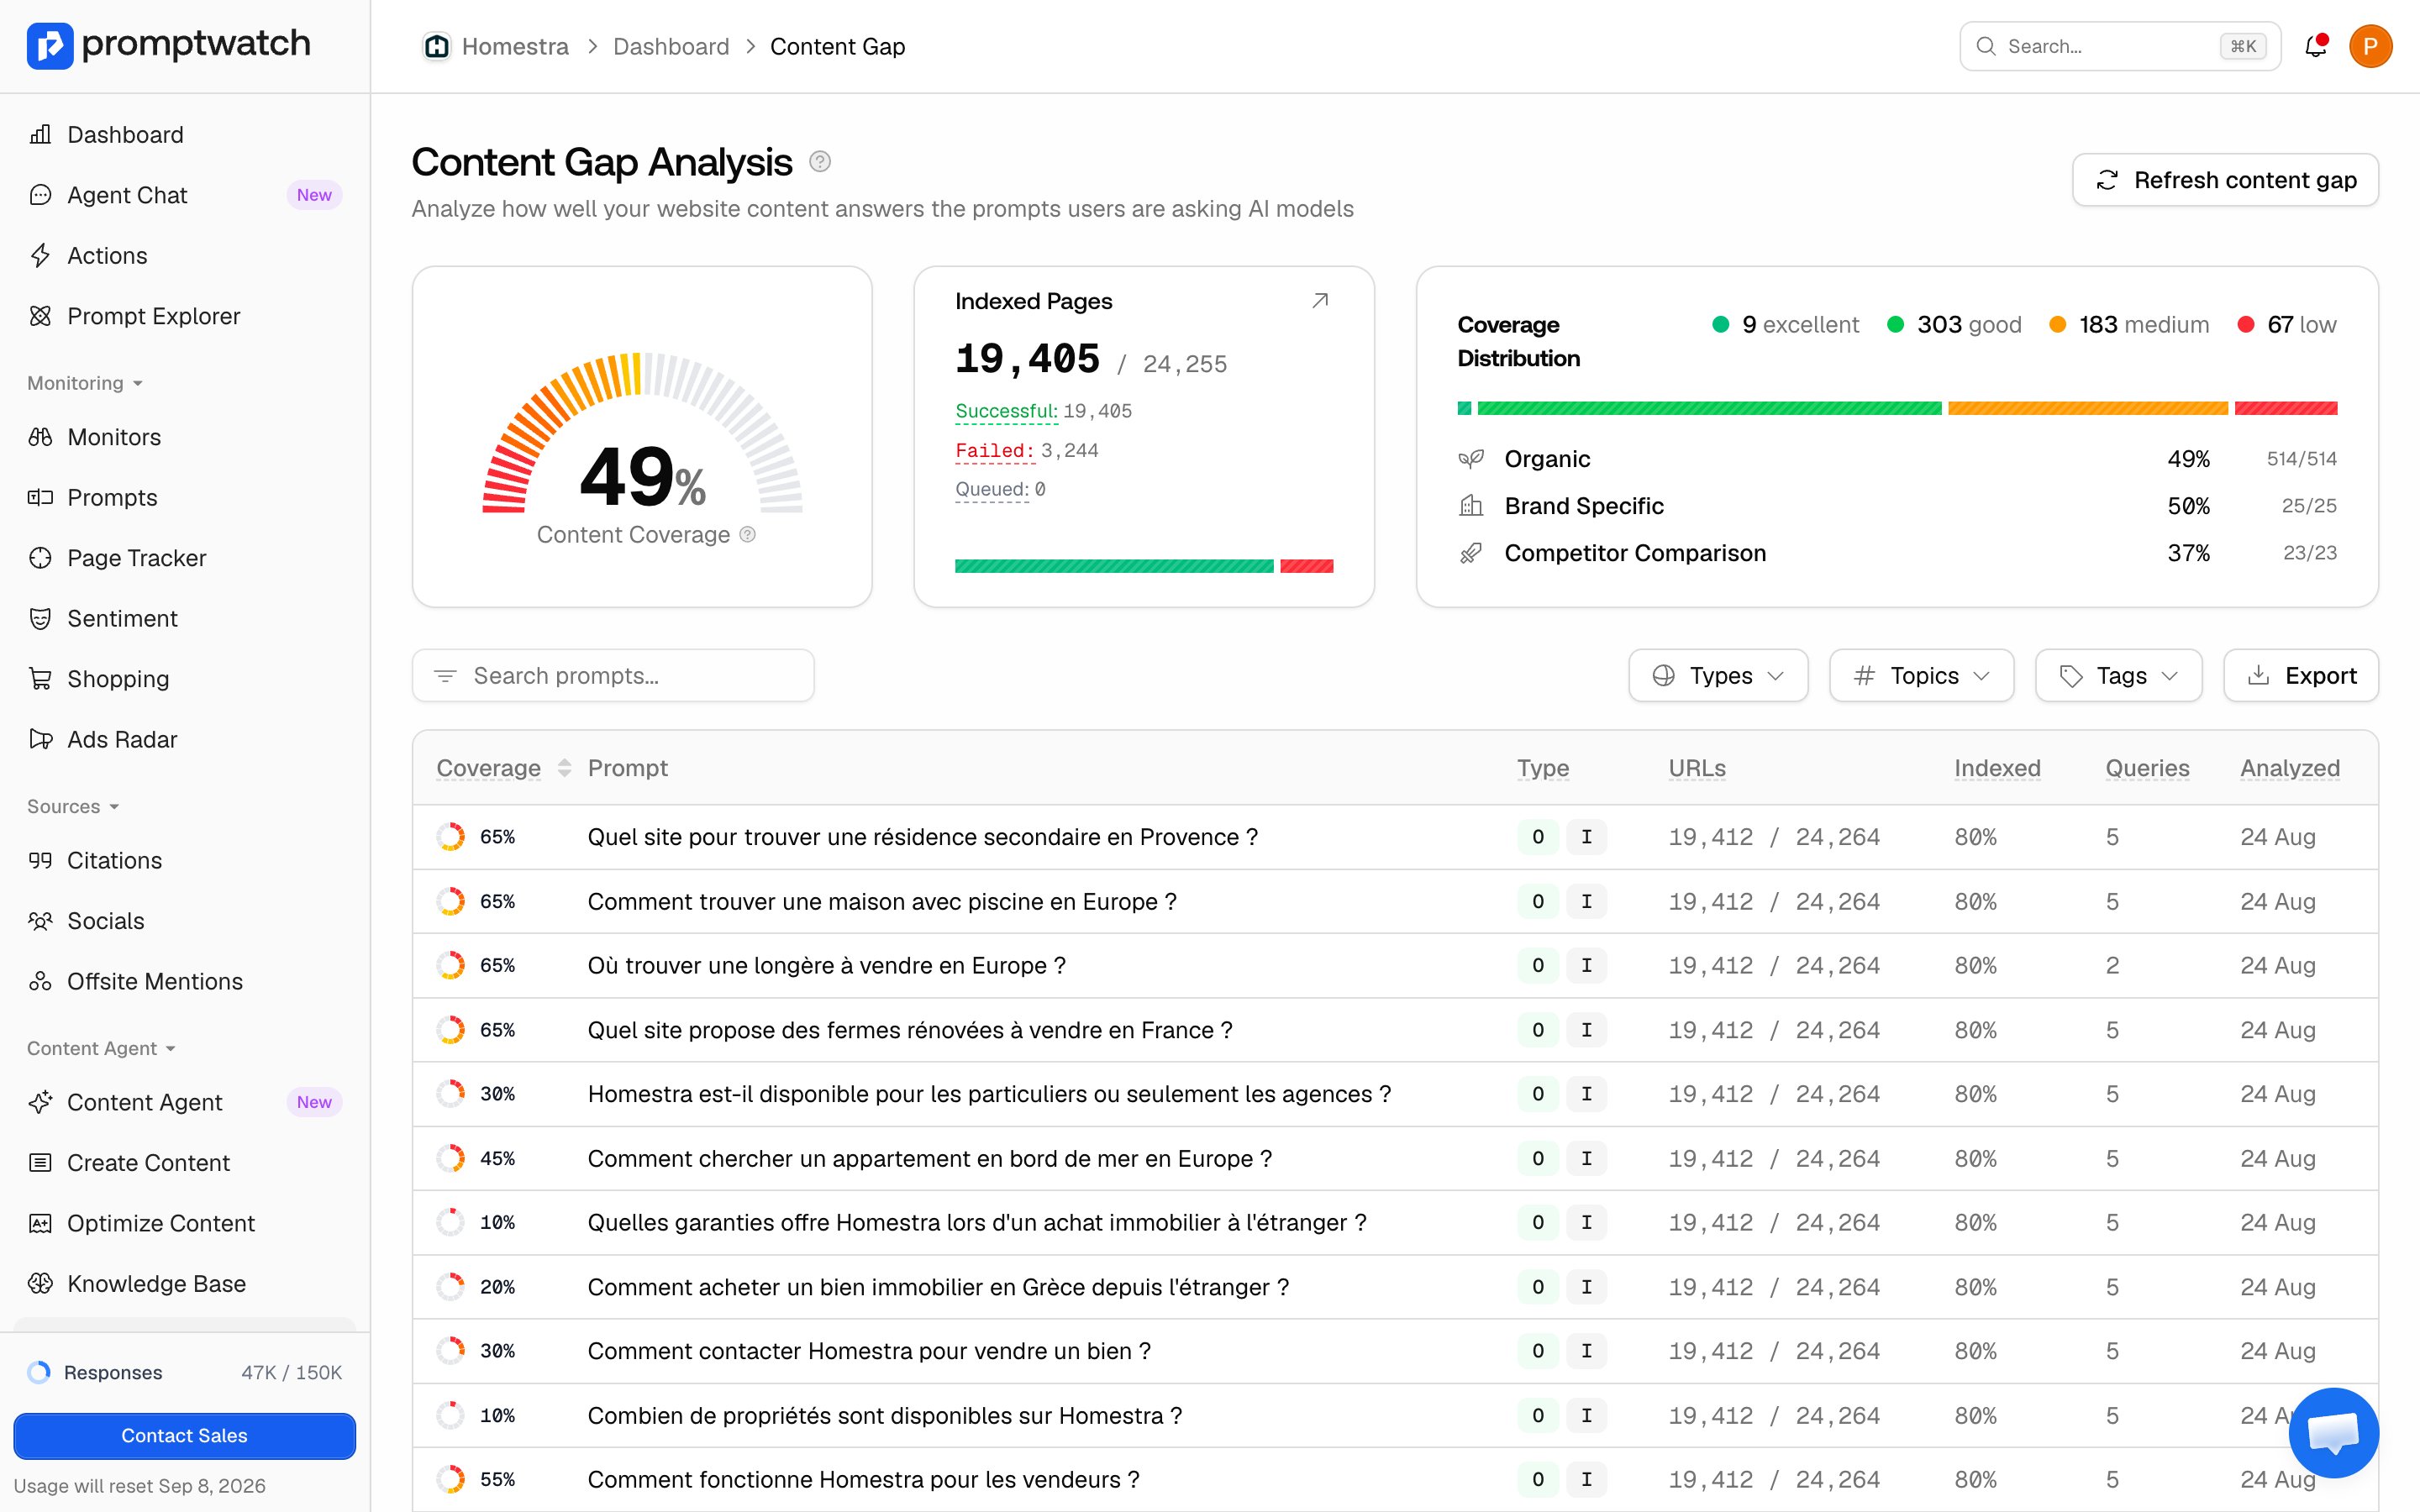
- Per page: run the Content Gap analysis, which scores how well your site covers each prompt’s underlying queries and turns misses into create-or-refresh recommendations rated by impact and effort.
Act on the top of the list
Work from the Action Board: the agent cross-references your gaps, sentiment, crawler activity, and offsite signals into a prioritized queue, so you spend the month executing rather than re-deriving priorities. For content work specifically:- Take high-impact, low-effort content gap recommendations first, and hand them to the Content Agent, each recommendation carries a Run content agent or Refresh page button. See turning a gap into a brief.
- Fix crawlability blockers surfaced in Crawler Logs and site health: a page AI bots can’t read can’t be cited, whatever its quality. See crawlability.
- Start one offsite motion. If your category’s answers cite Reddit or YouTube heavily, that channel outweighs another blog post; the Reddit and YouTube strategy is the companion playbook.
Month 3 (days 61-90): measure what moved, keep what works
Track the causal chain, not just the score
Add every page you published or refreshed to the Page Tracker. Its per-page view shows the chain you’re trying to complete: AI crawler visits first, then citations from your tracked prompts, then click-throughs. Crawls without citations point at content that gets read but not used; no crawls at all point back at crawlability.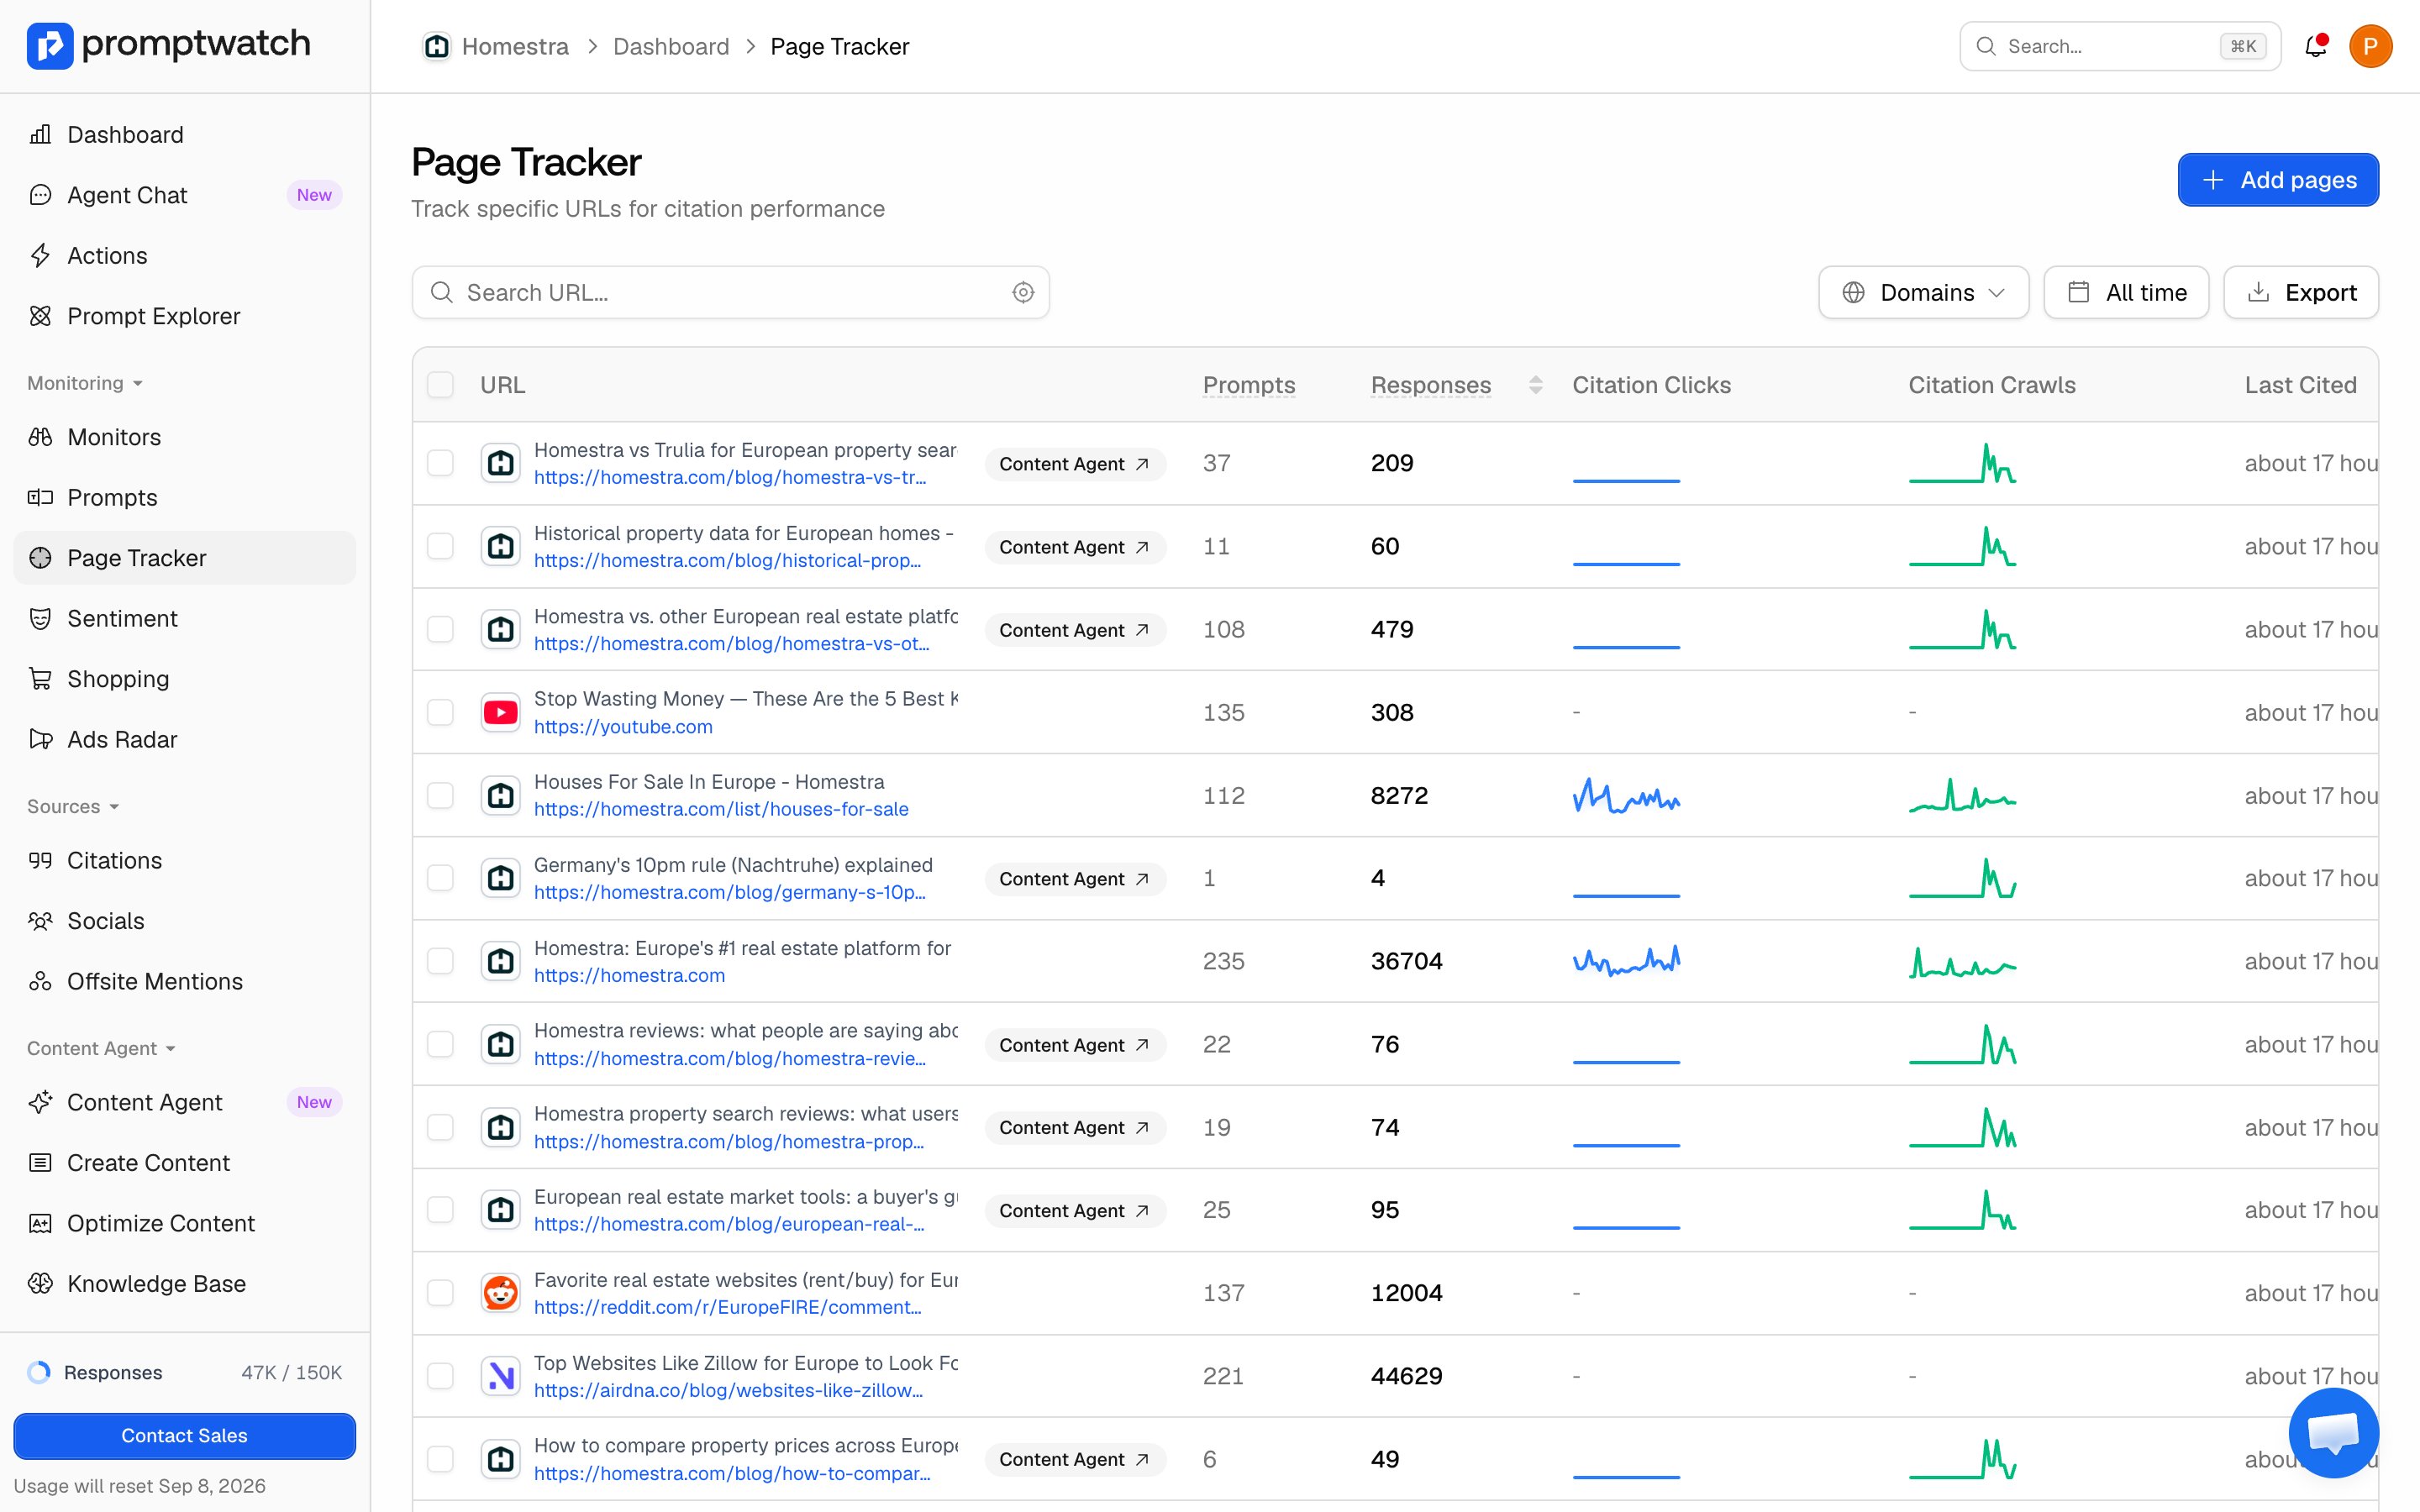
Prune, expand, and report
- Retire prompts that produced no decisions, add prompts for the gaps and fanout patterns you discovered, and label everything with topics and tags so next quarter’s analysis is a filter, not a project.
- At day 90, build the comparison against your day-30 baseline and share it as a report. Stakeholders don’t need every chart; they need “here’s where we were, here’s what we shipped, here’s what moved”.