

What a report contains
There are two report types:- Dashboard report: covers your whole project. It includes your score gauges, AI platform traffic, the brand visibility chart, brand sentiment over time, top cited domains, and the competitor visibility heatmap.
- Monitor report: visibility score, brand visibility, brand sentiment, top cited domains, and the competitor heatmap, scoped to a single monitor, so you can report on one market or language without the noise of the rest of your project. See What is a Promptwatch Monitor if you’re not using monitors to segment yet.
How to create one
- Open your project dashboard, or a monitor page for a monitor report.
- Click the Export button (the PDF icon).
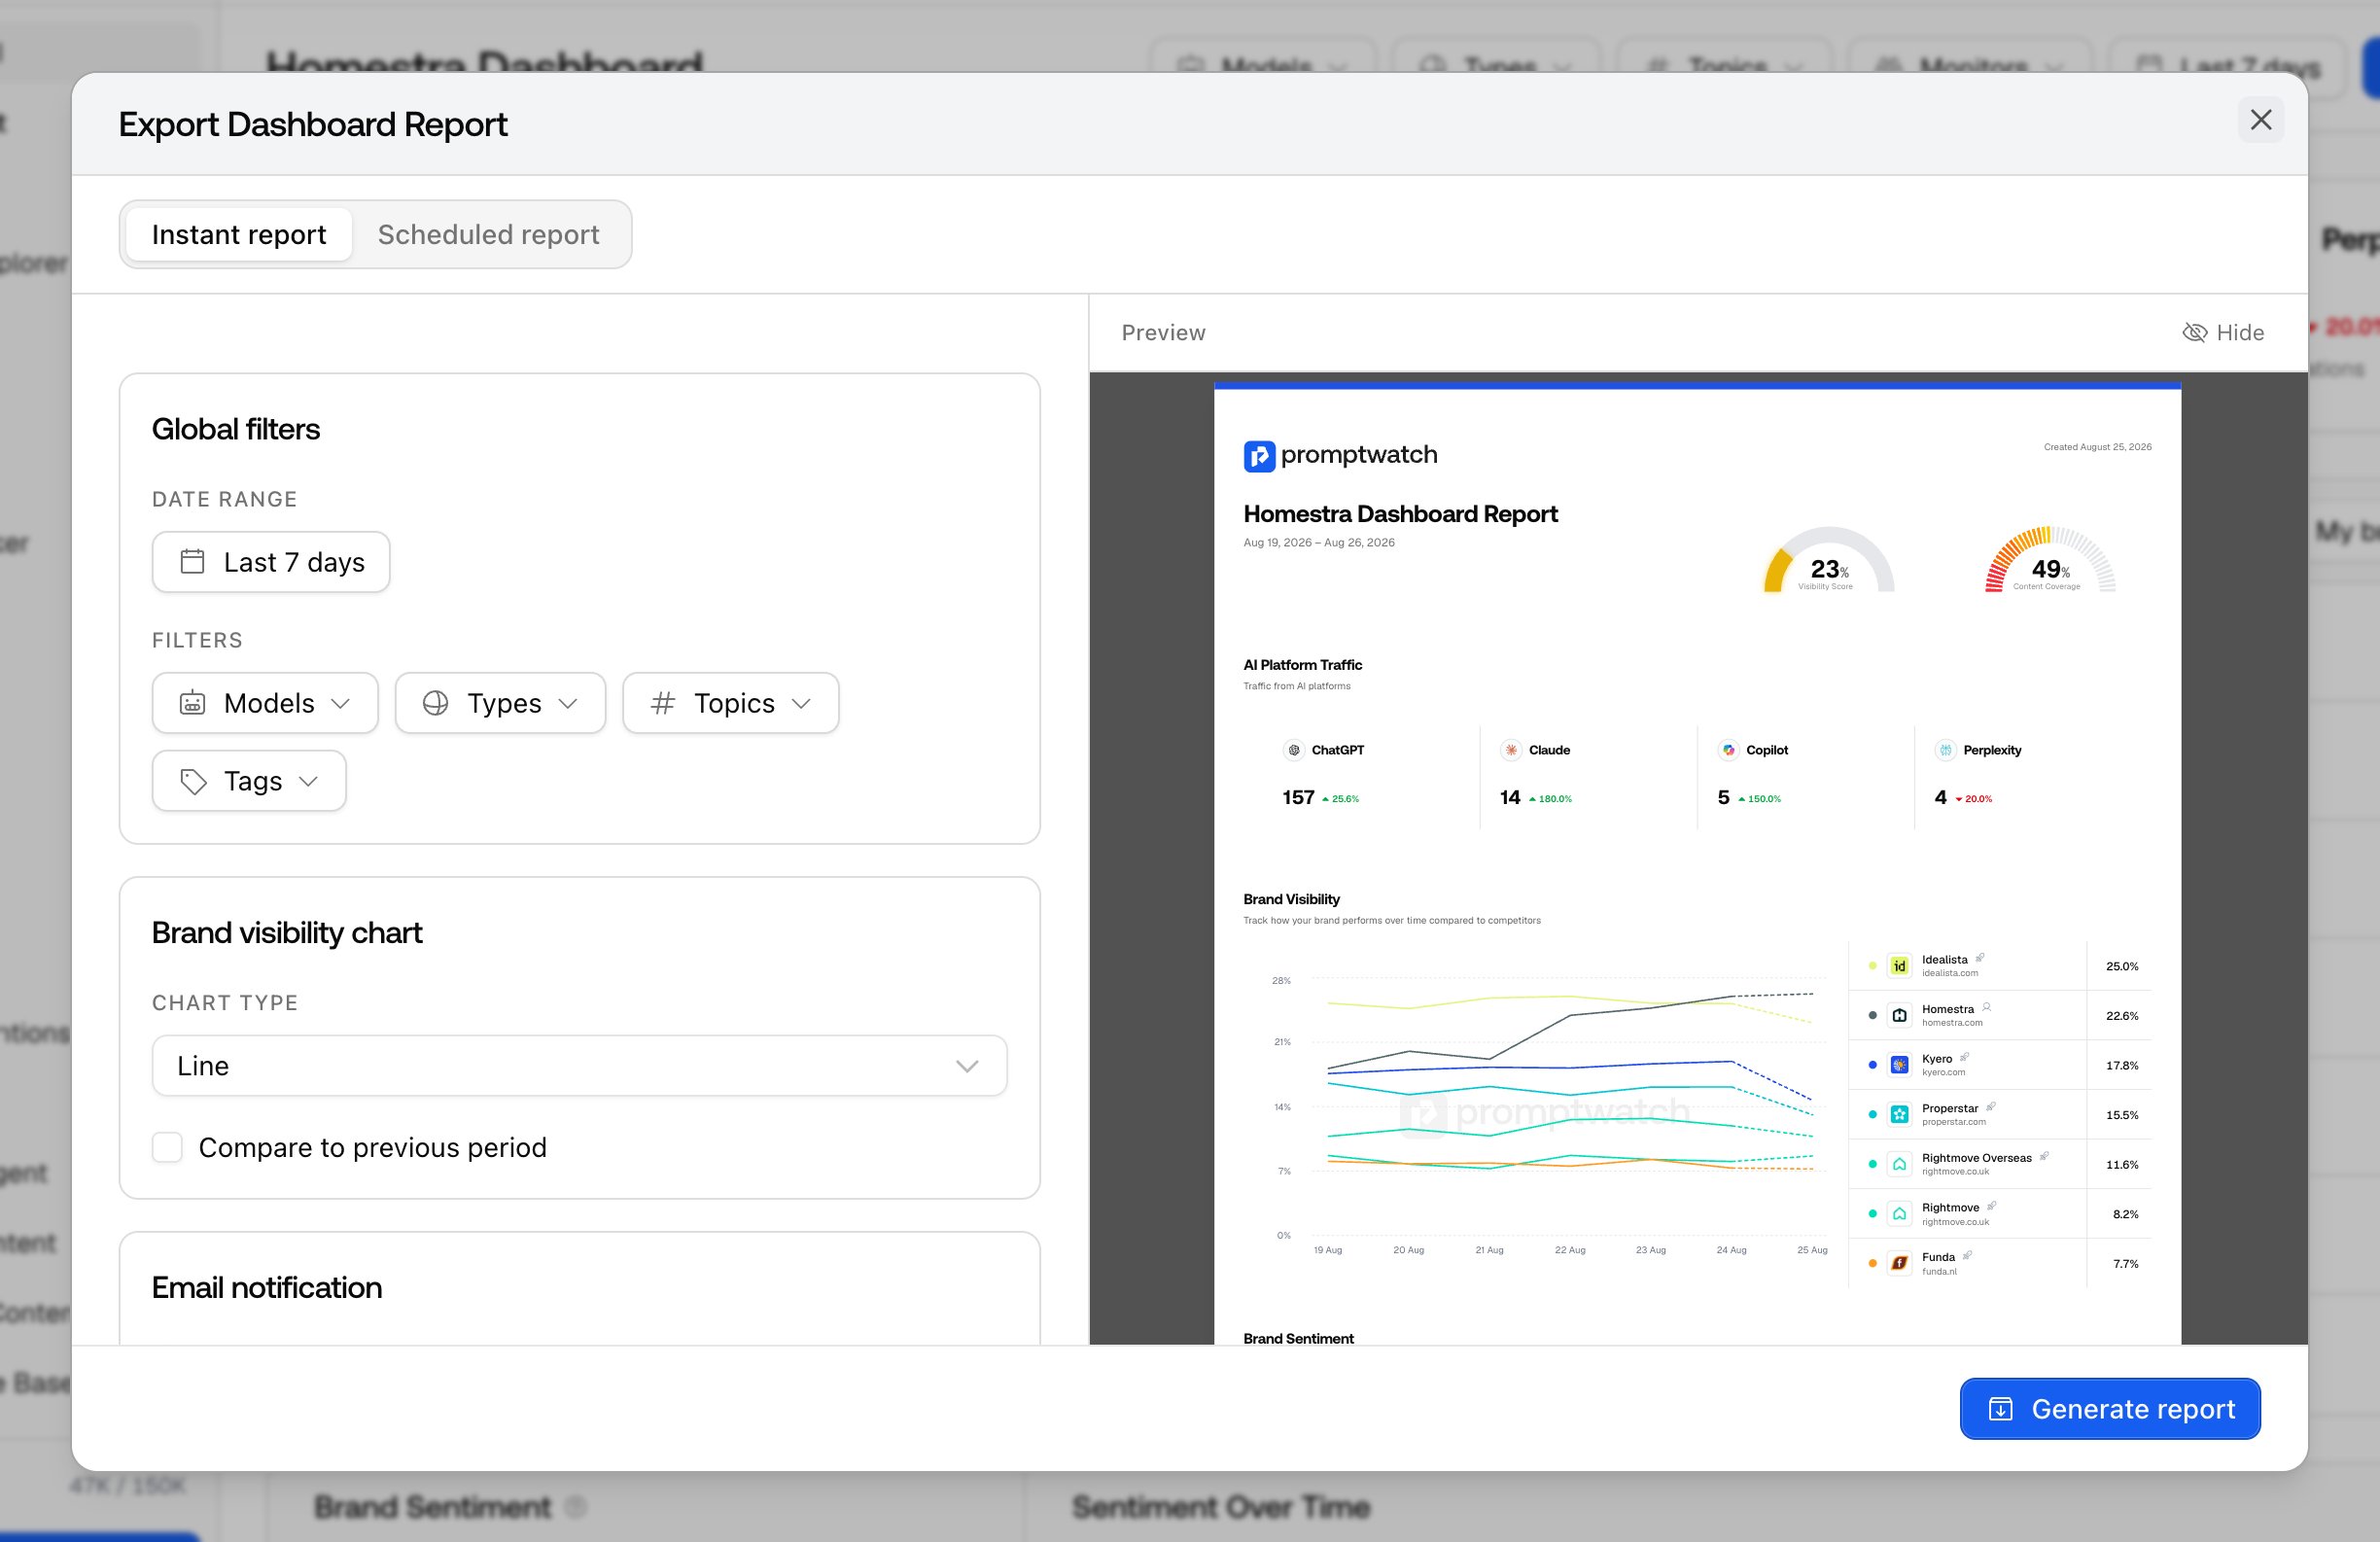
- In the export modal, stay on the Instant report tab.
- Adjust the filters and click Generate report.
Filters and options
- Date range: presets like last 7 or 30 days, or a custom range.
- Global filters: AI models, prompt types, topics, and tags. Monitor reports also let you filter by intent type.
- Chart type: choose how the brand visibility chart renders: bar, line, share of voice, or rank.
- Compare to previous period: adds period-over-period comparison to the brand visibility chart.
- Email notification: check “Email me the PDF report once generated” and the finished PDF arrives in your inbox, so you don’t have to wait around for larger reports.
Where the report lands
Reports generate in the background, so you can keep working while charts render. When it finishes, open Reports from the user menu (under Reporting), then the PDF Reports tab; a toast also links there. Each row shows the report type, the filters it was created with, and a Download button. Download links are refreshed automatically, so older reports stay downloadable.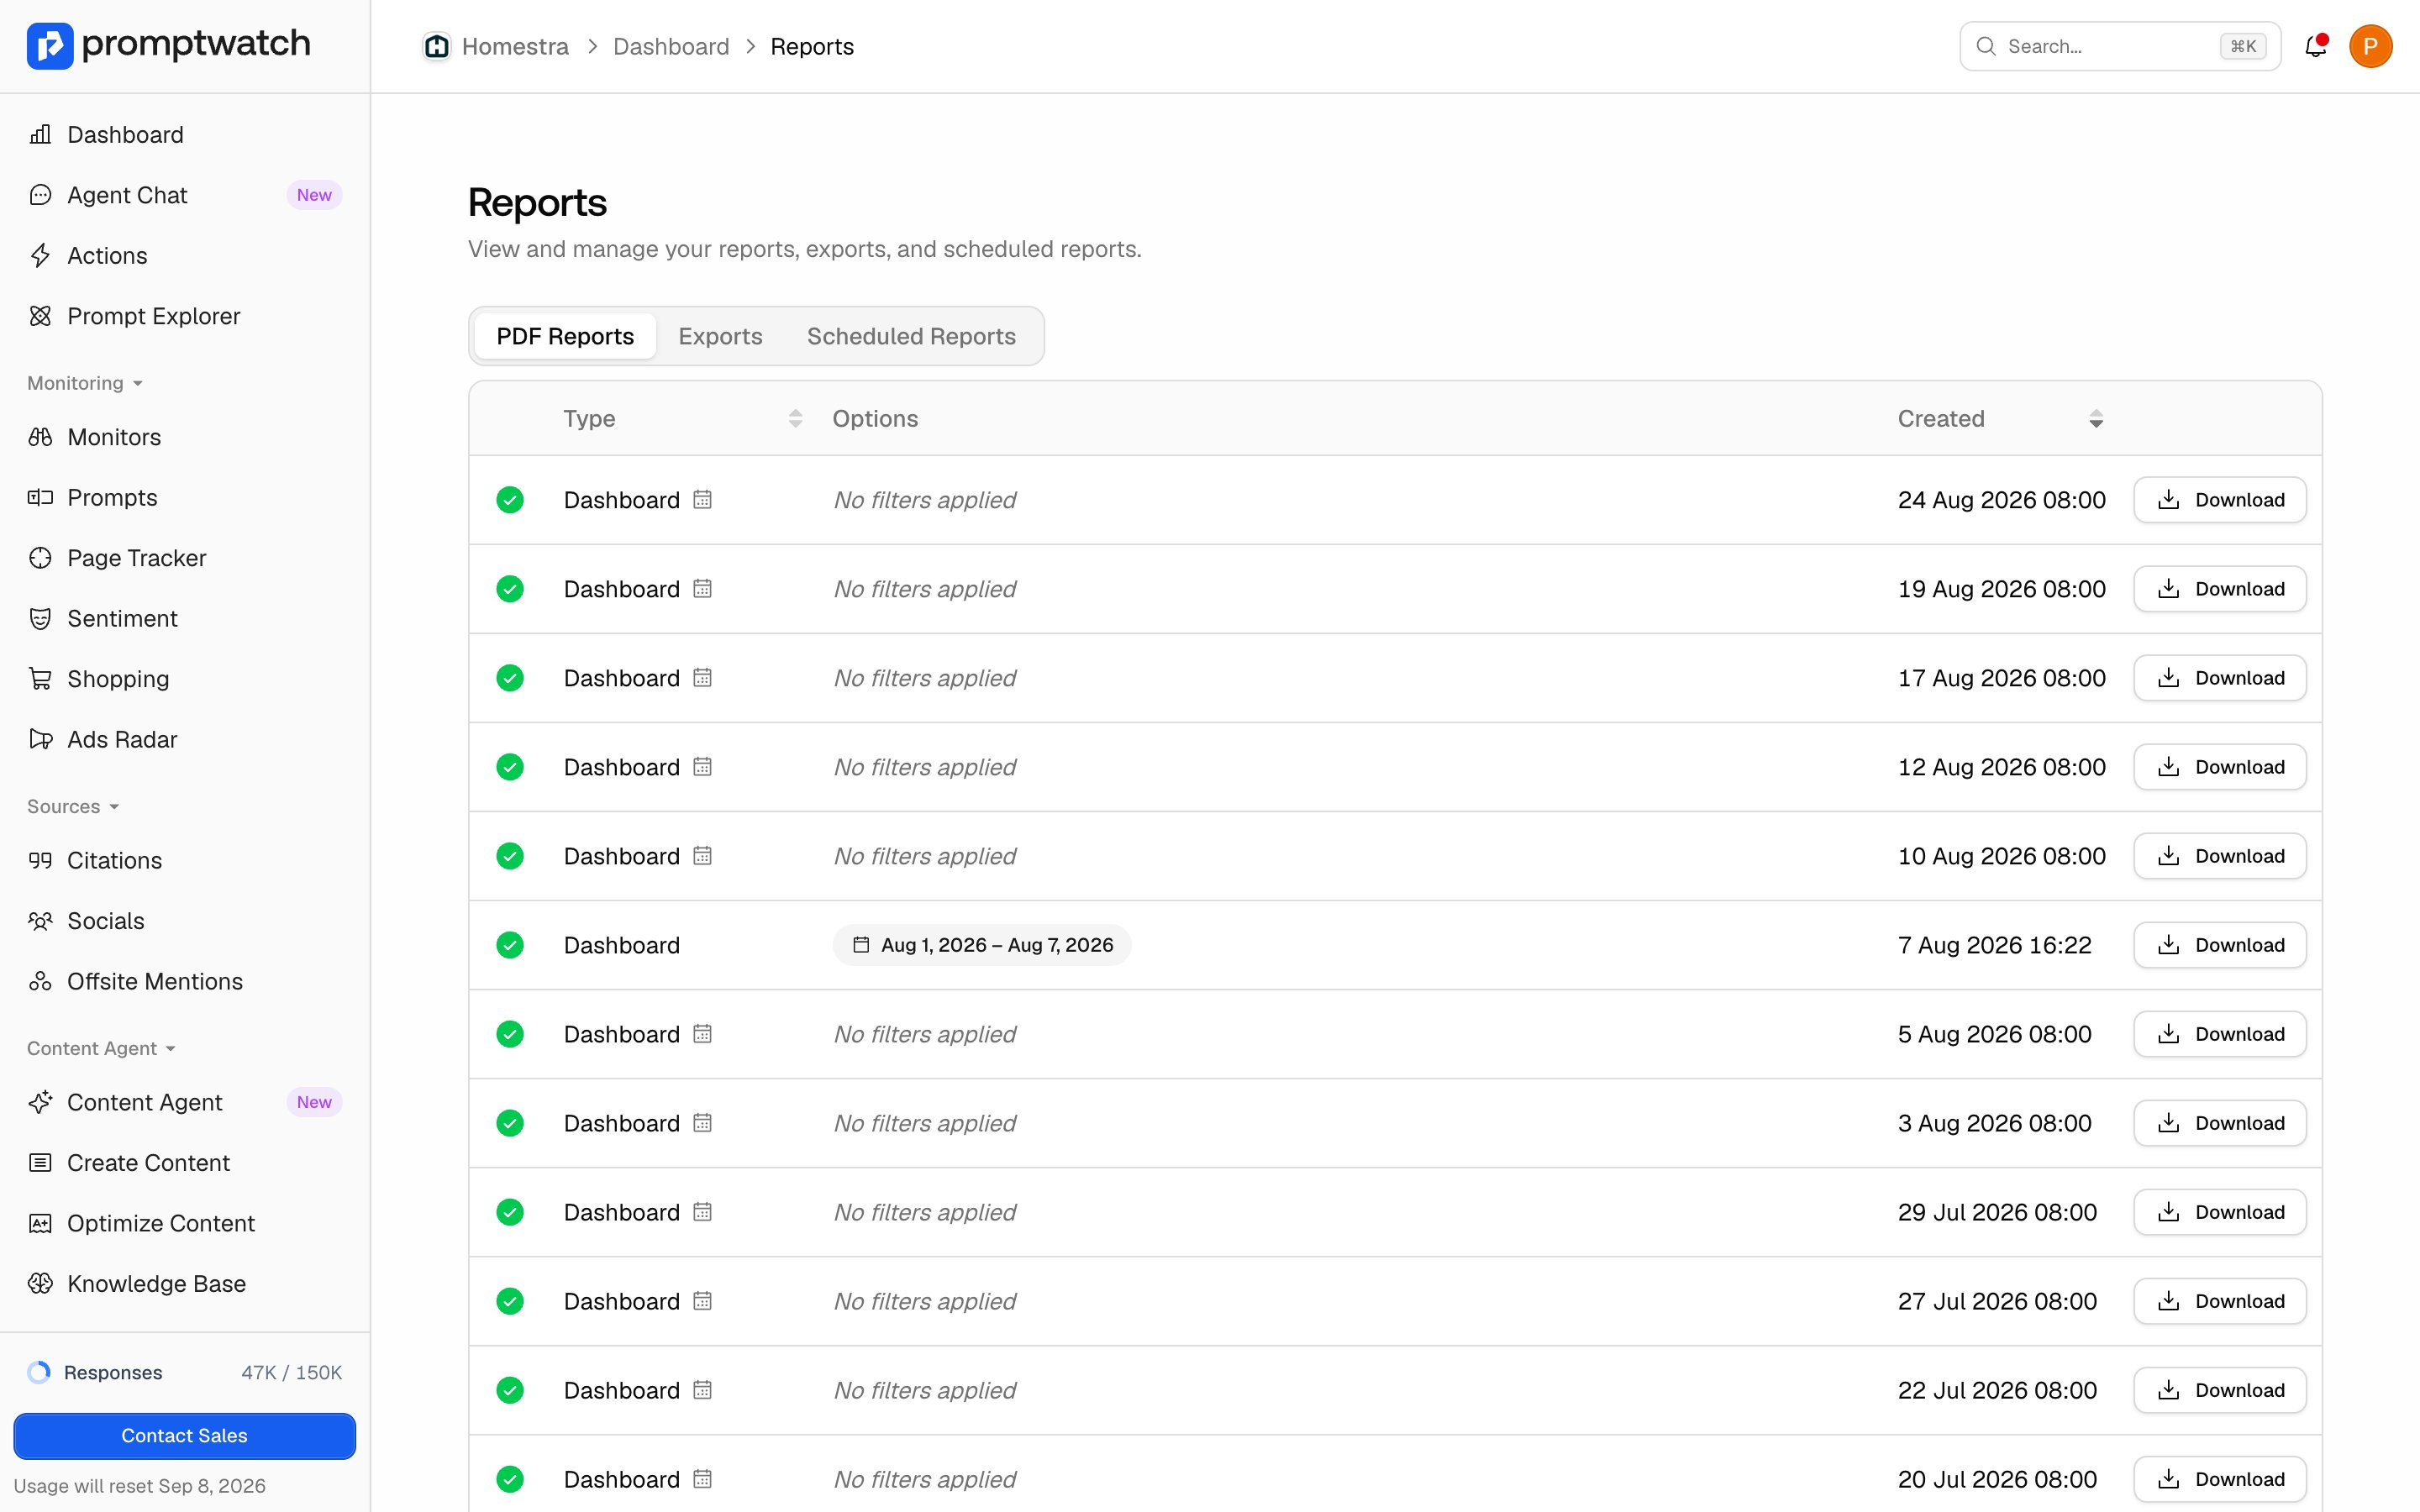
- Three at a time: each project can have up to 3 reports generating at once. Wait for one to finish before queueing a fourth.
- Plan availability: PDF reports are available on Professional and above. On plans without them, Generate report opens an upgrade prompt.