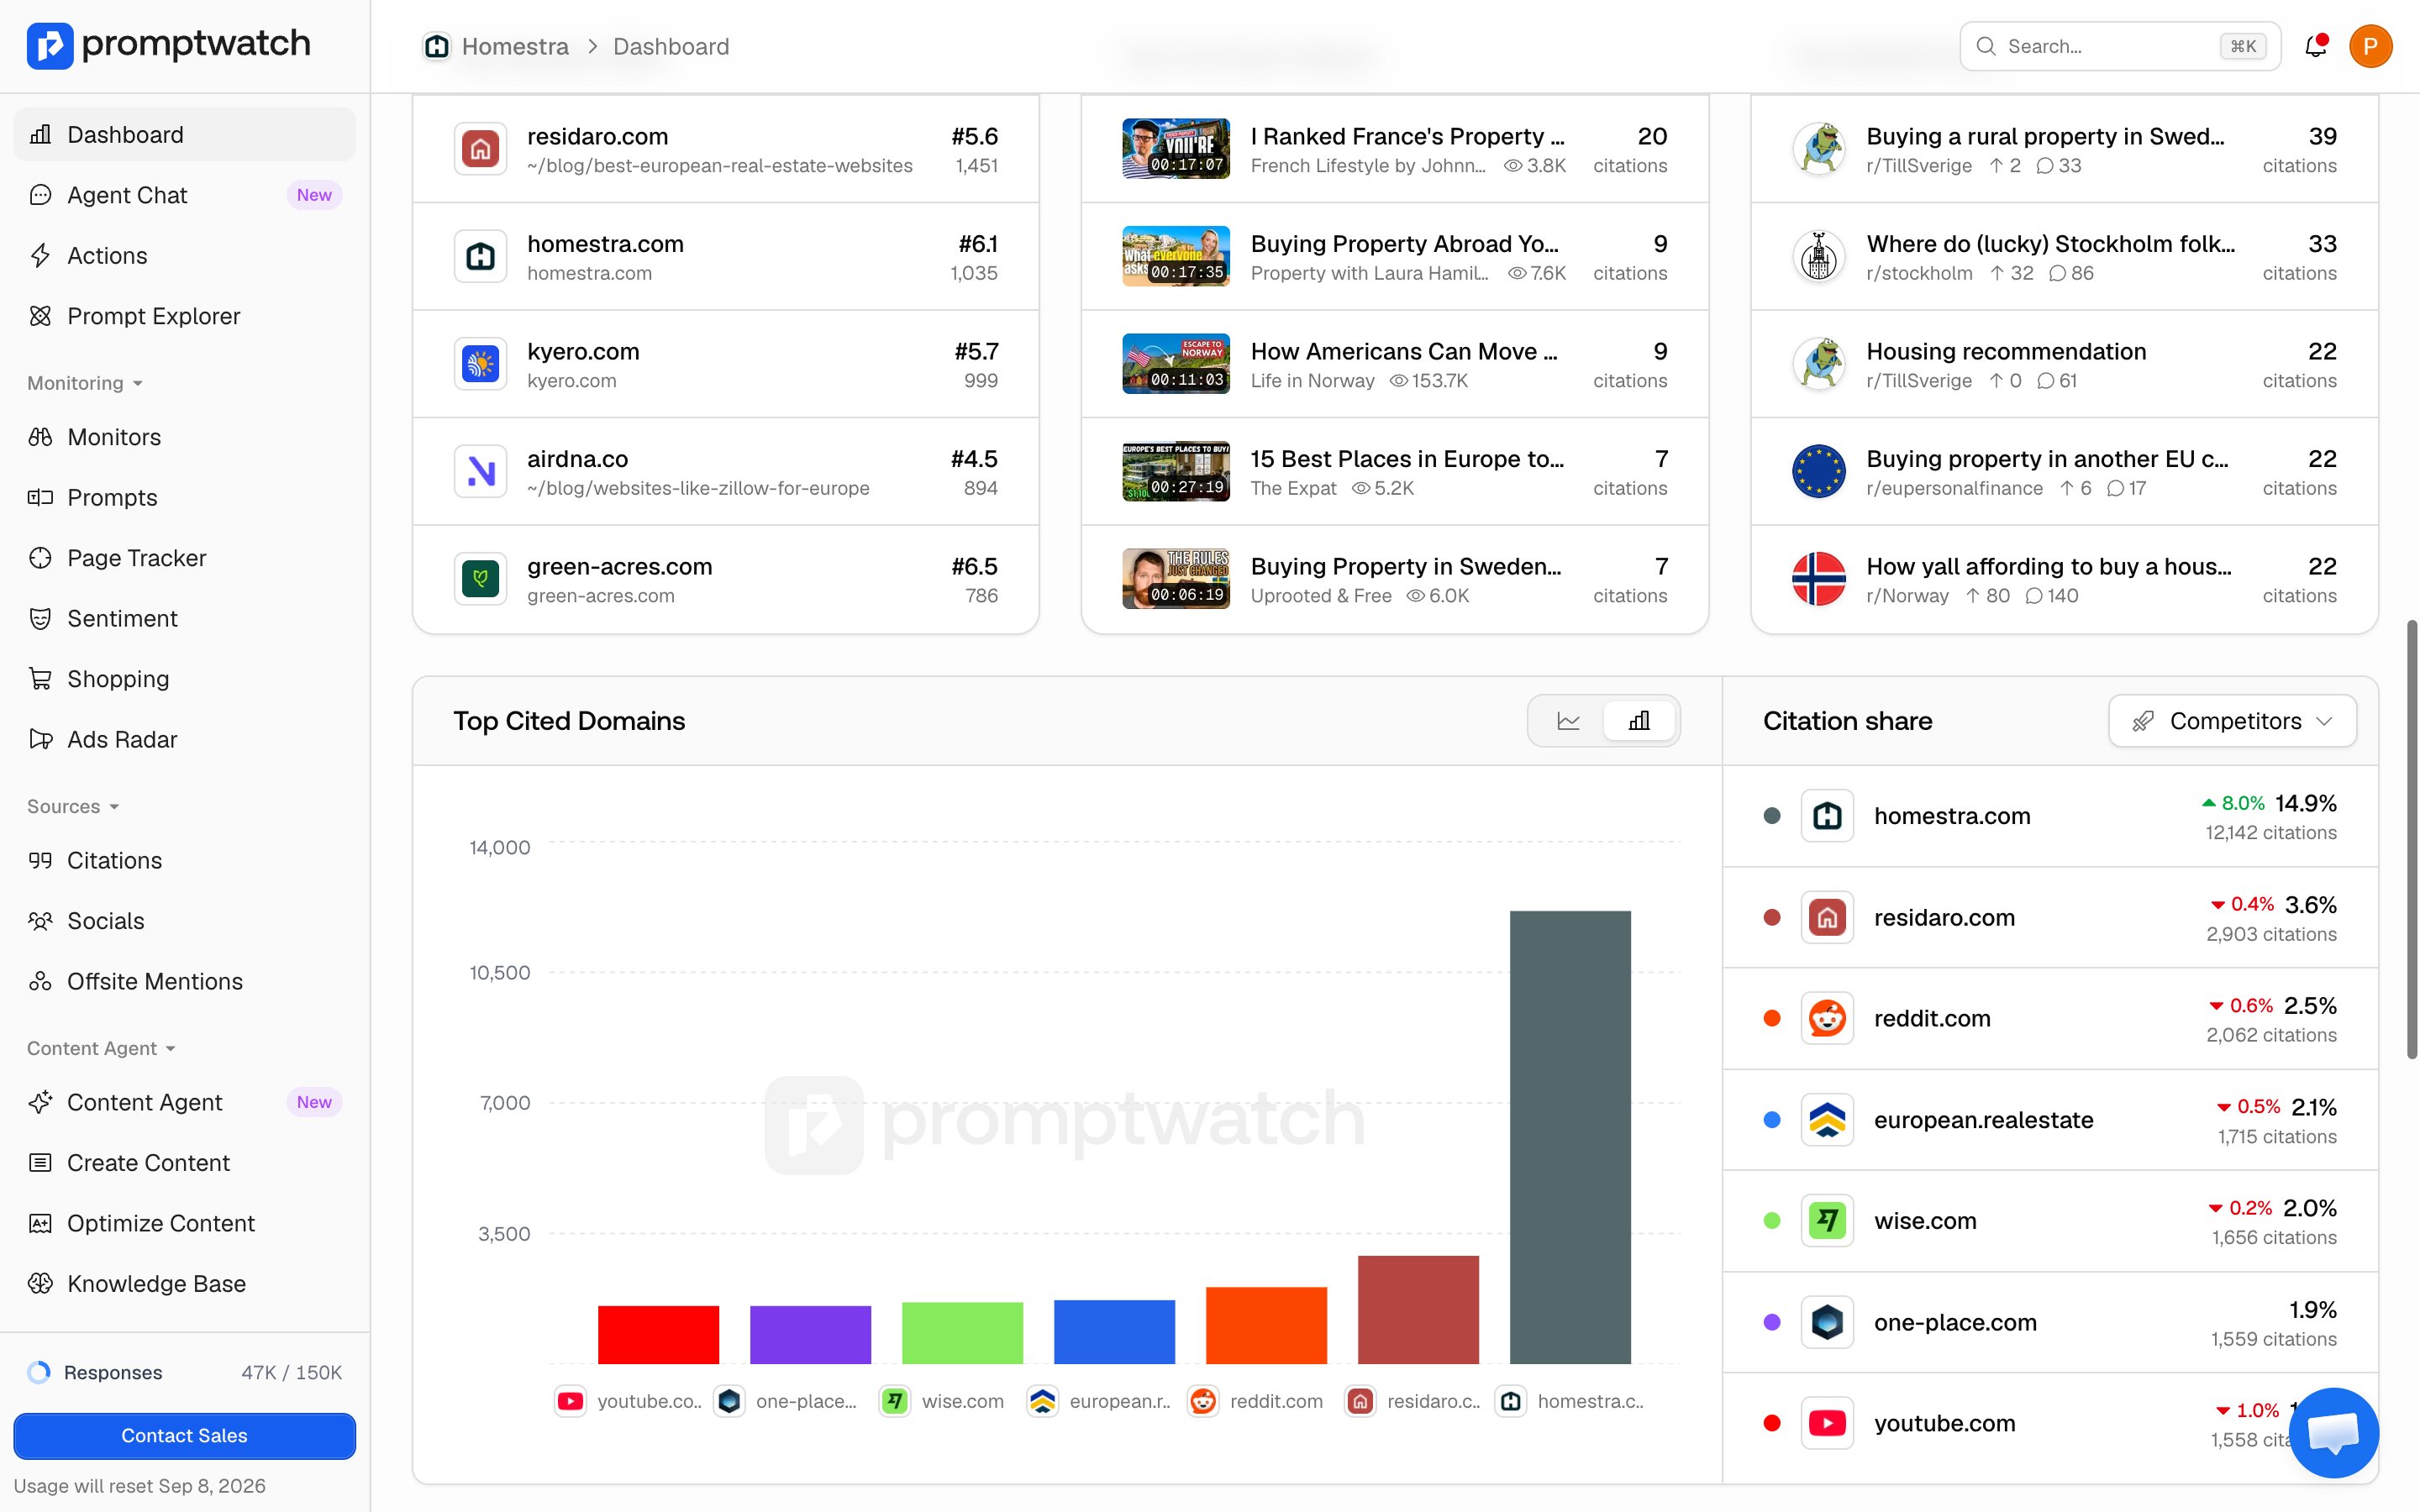
The score gauges: how am I doing overall?
- Visibility Score: your 0-100 average across all analyzed responses in the period, where responses that don’t mention you count as zero. This is your headline number. See Visibility Score for how it’s calculated.
- Content Coverage: how well your website answers the questions behind your tracked prompts. A low score here means AI models want to discuss topics your site doesn’t cover yet. See Content Gap.
The visitor cards: is AI visibility becoming traffic?
The row of platform cards (ChatGPT, Claude, Copilot, Perplexity) shows the human side: visitors who clicked through to your site from each AI platform, with the change against the previous period, plus a citation count from your crawler logs where available. These cards need visitor analytics and crawler log setup; until then they show placeholder data with setup links.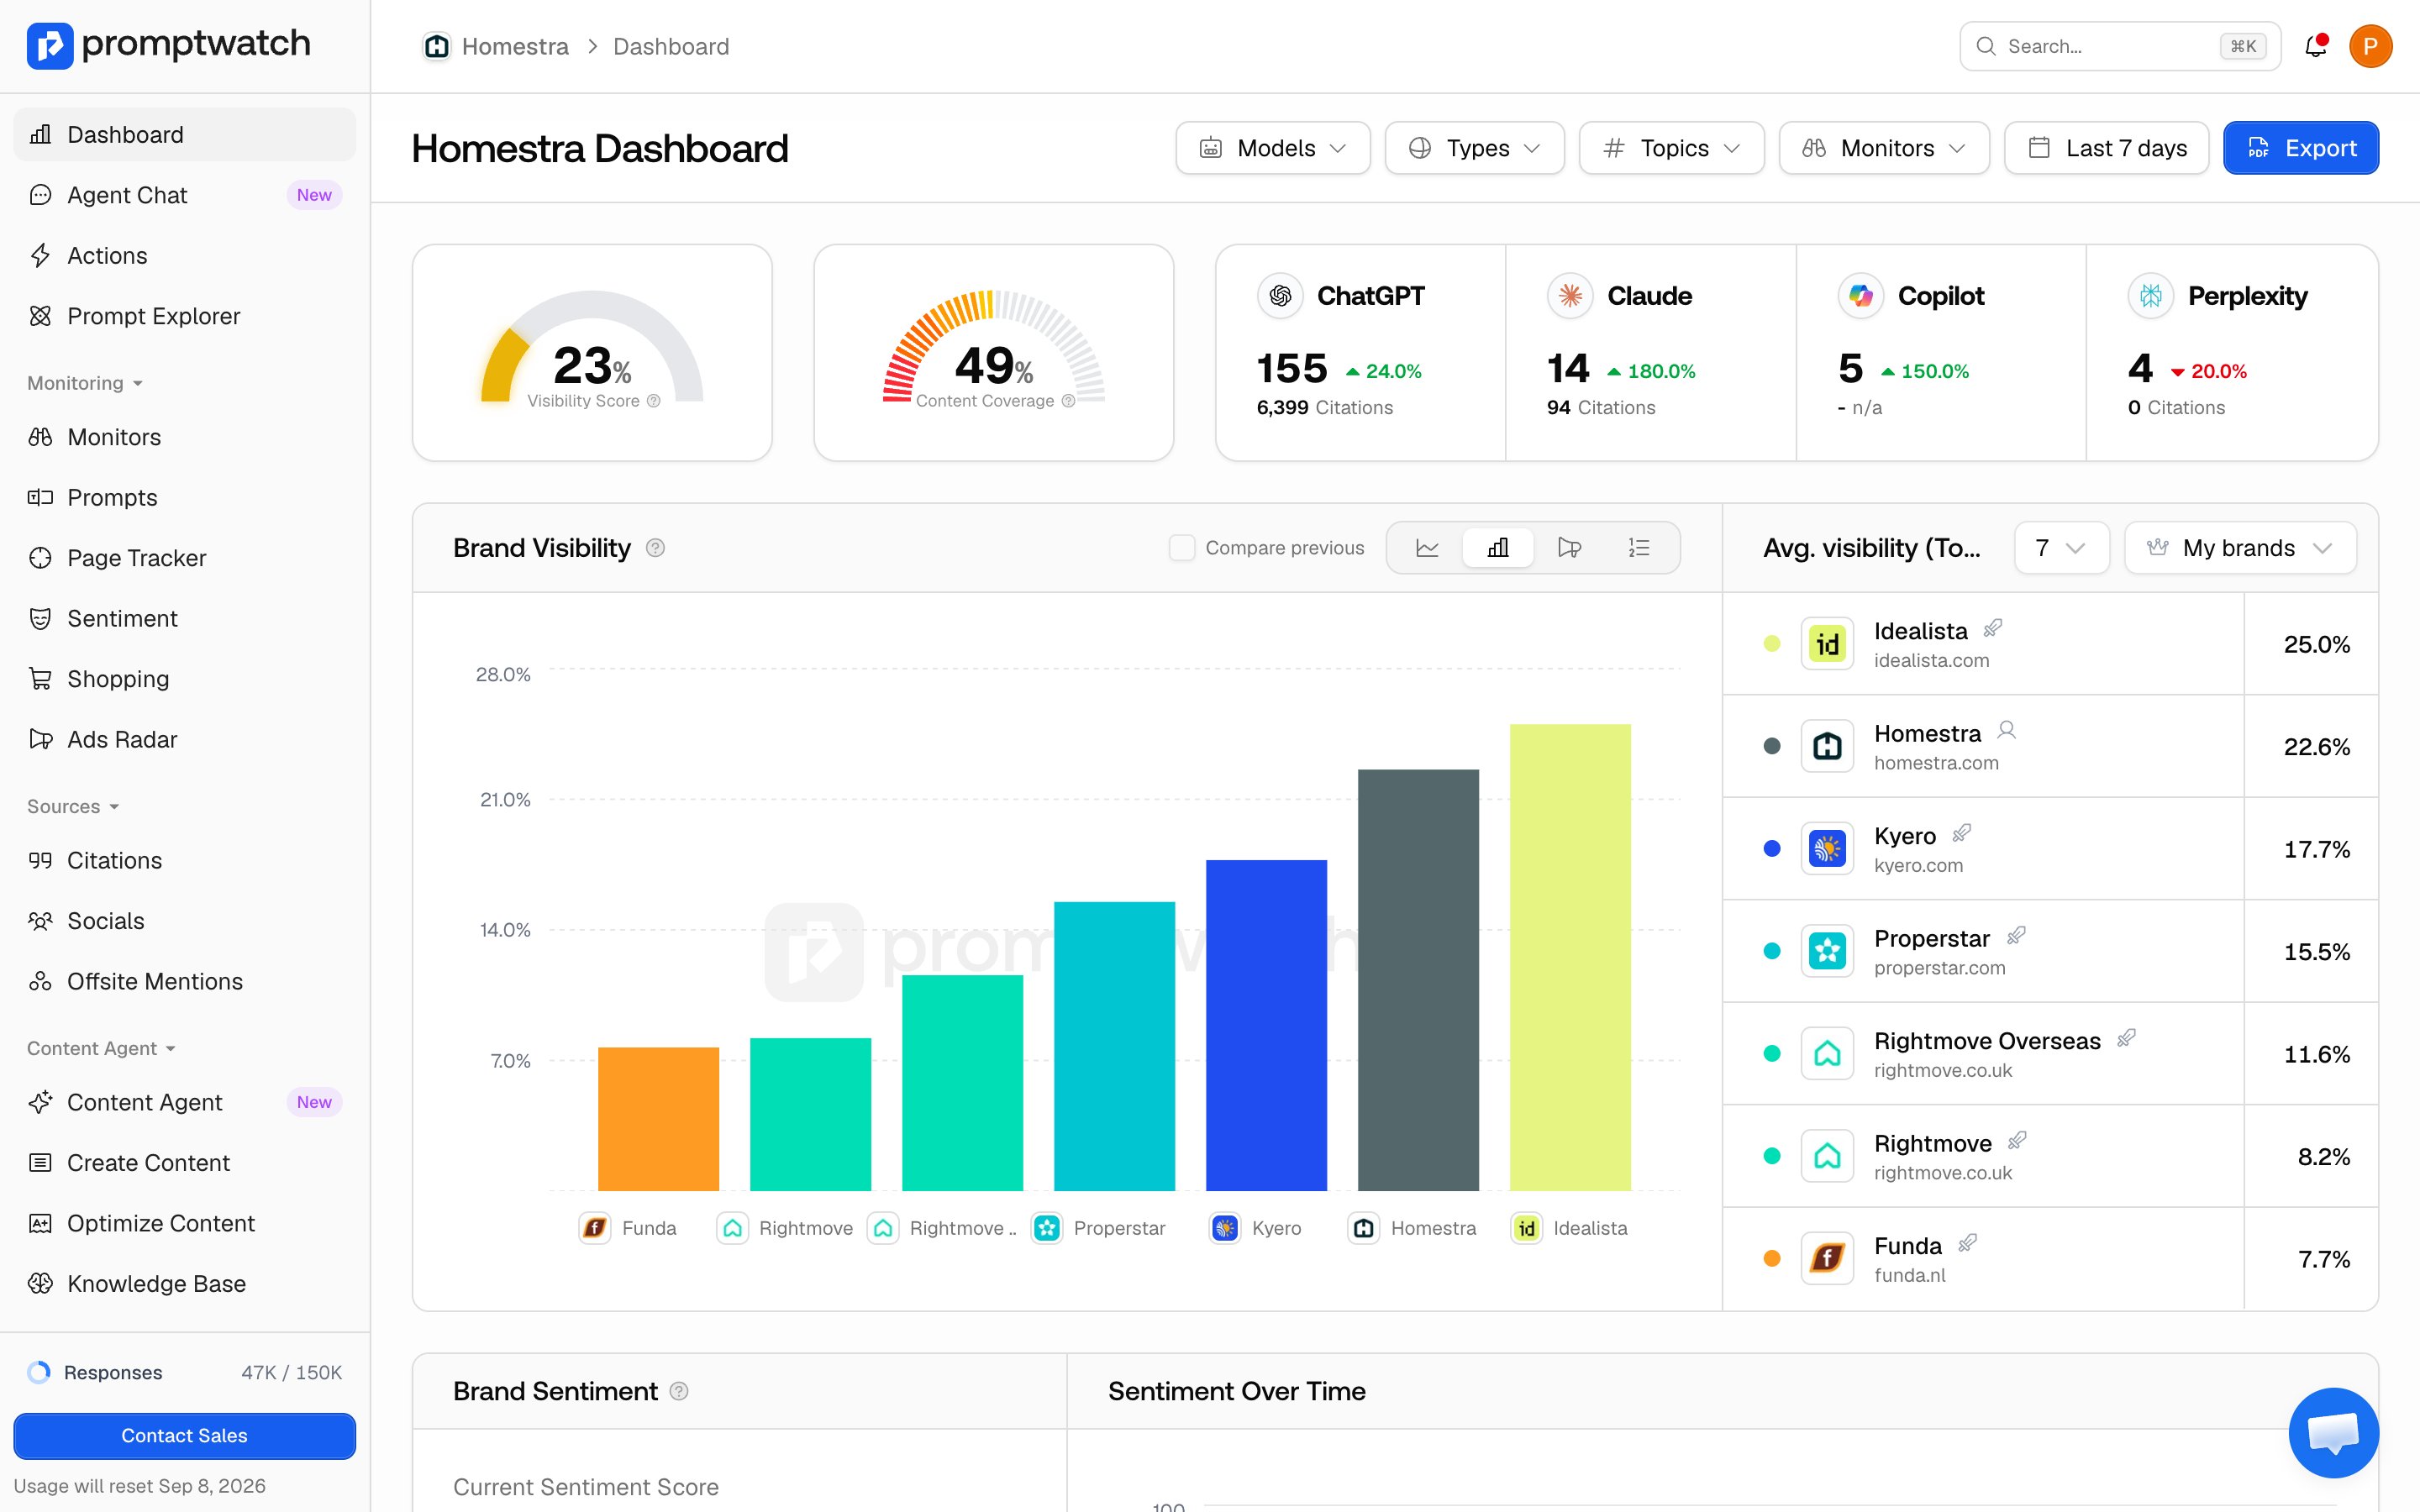
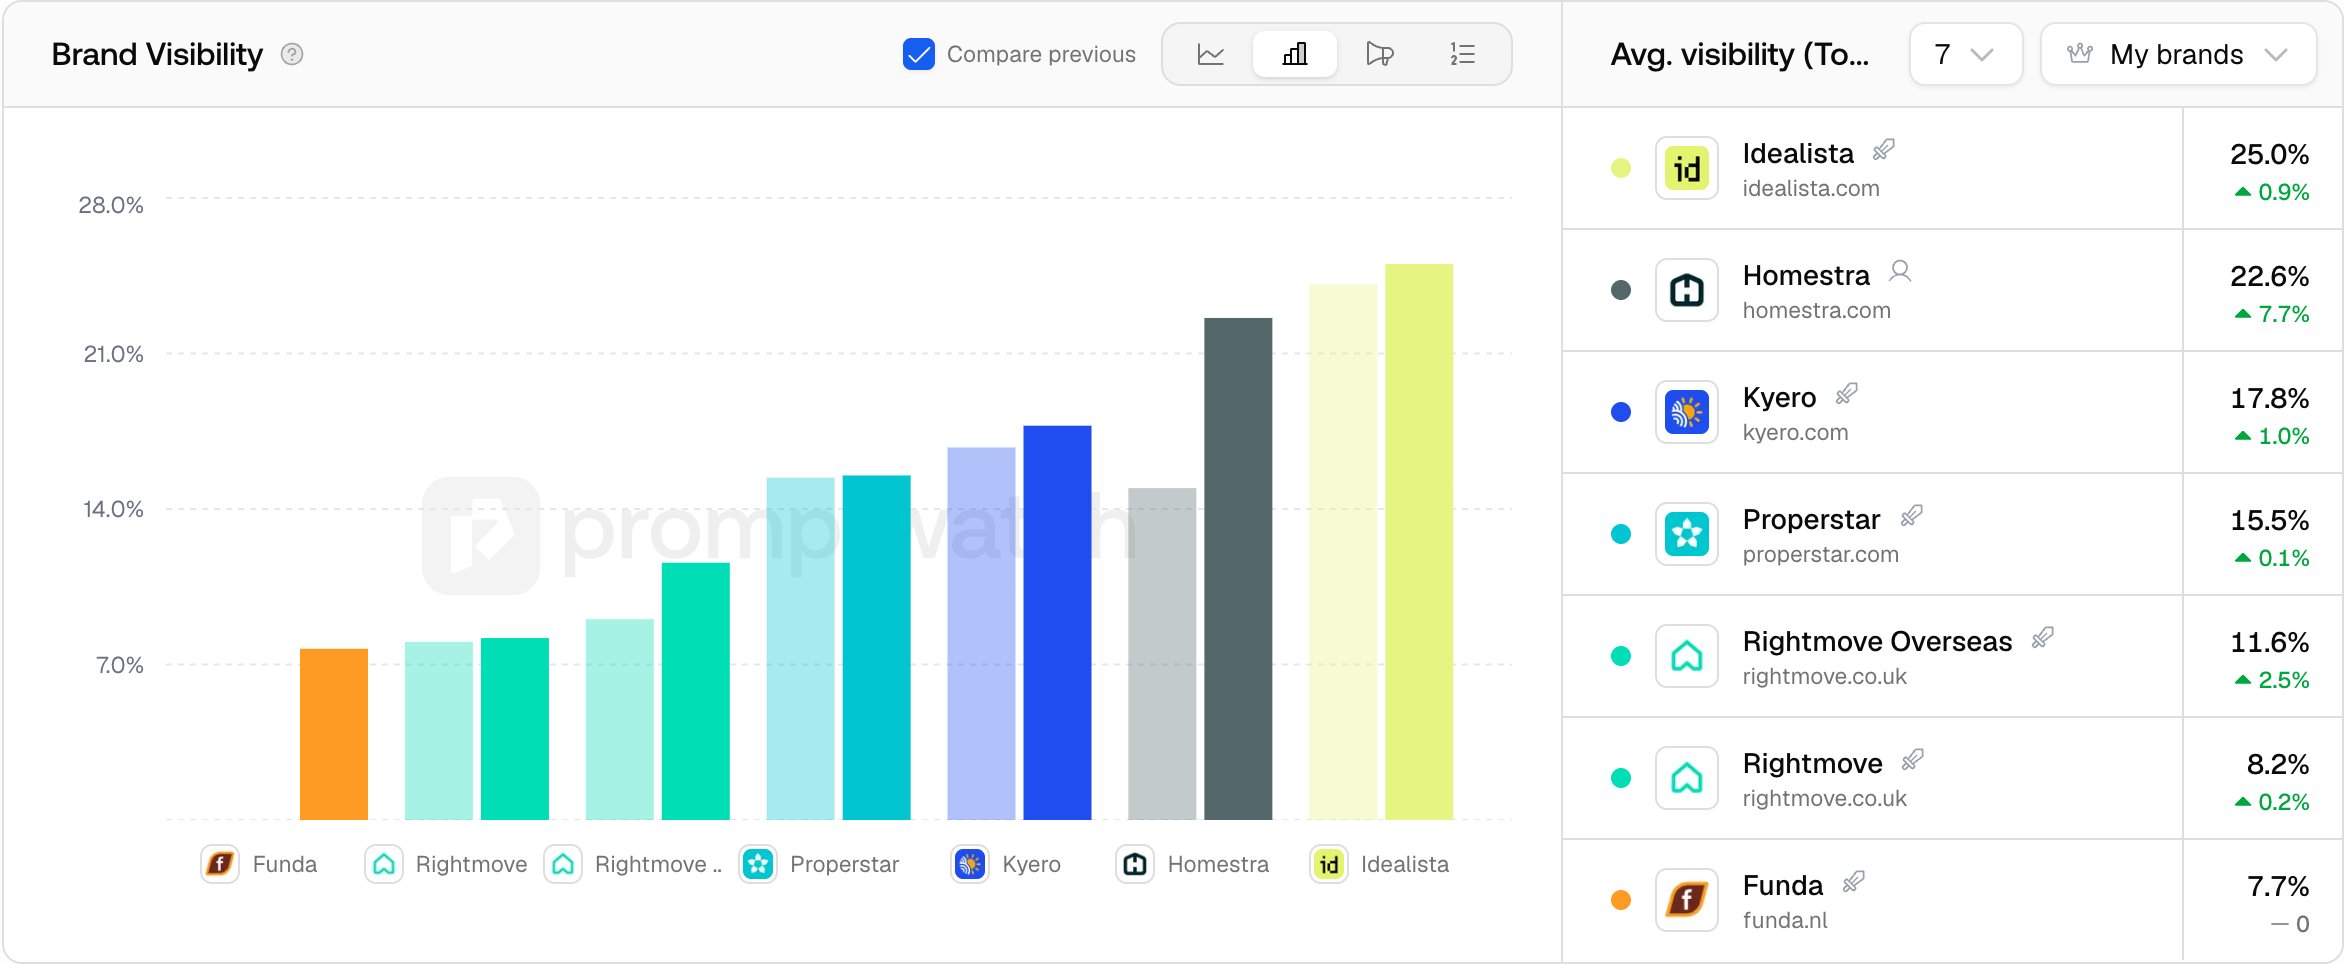
The Brand Visibility chart: who is winning, and is it changing?
The main chart compares your brand against detected competitors, with a brand list beside it showing each brand’s numbers for the period. It has four views, switchable with the tabs in the header:- Line: visibility over time per brand, the view for spotting trends and sudden drops.
- Bar: average visibility per brand for the whole period, the view for a ranking snapshot.
- Share of Voice (the megaphone icon): each brand’s share of total mentions, so you see who owns the conversation. See Share of Voice.
- Rank (the numbered list icon): brands ordered by average position in answer.
Sentiment over time: how do models talk about me?
The sentiment chart tracks your 0-100 sentiment score across the period, next to your current score. Visibility tells you whether you appear; sentiment tells you whether the appearance helps. For per-attribute detail, open Sentiment tracking.Visibility by Country: where in the world am I visible?
The world map colors each country by your average Visibility Score there, based on the AI responses collected by monitors running in that country. Darker countries are markets where AI assistants mention your brand more prominently; lighter ones are markets where you are barely part of the answer. Beside the map, a Countries list ranks the countries with responses in the current period by score, with their response counts. The map doubles as a setup tool. A supported country you do not track yet is clickable, and clicking it opens the Create Monitor dialog with that country already filled in (named, for example, “Germany Monitor”), so you can start covering a market the moment you spot a gap. Creating a monitor this way needs full project access; view-only users can read the map but not click through. See creating a monitor.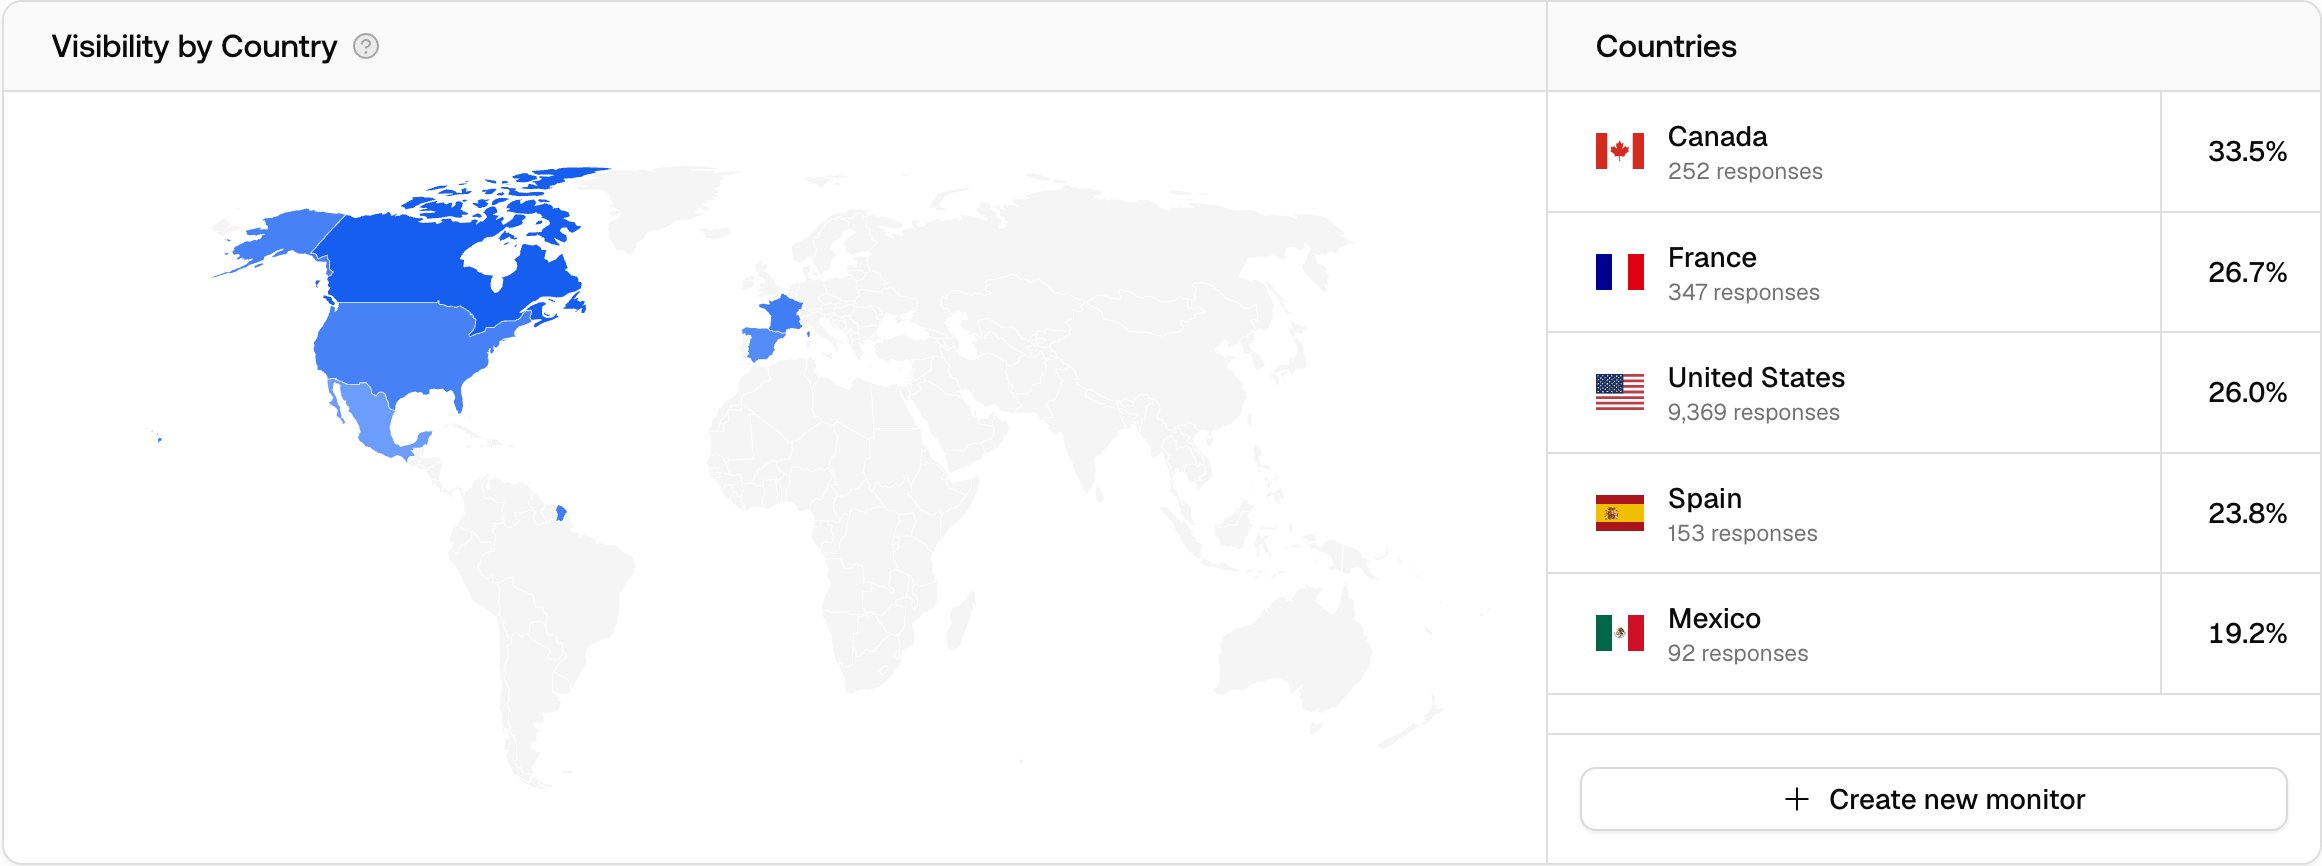
The source widgets: what is feeding the answers?
- Top Ranked URLs: the five most-cited pages across your responses, each with its average citation rank and citation count. Click a URL to open its detail view.
- Top YouTube Videos and Top Reddit Posts: the videos and threads models cite most for your prompts, so you know where the community conversation lives. Detail pages: YouTube citations and Reddit citations.
- Top Cited Domains: which domains earn citations over time, with a citation share list beside the chart. This is where you check whether your own domain is among the sources, covered in depth in Using citations.